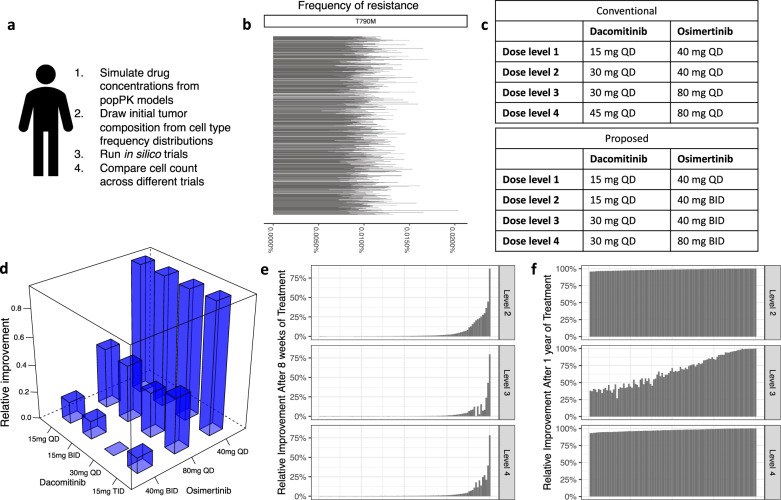
Fig. 3. In silico clinical trials of osimertinib and dacomitinib combination therapy.
a Schematic overview of simulation steps comparison of dosing schedules for one individual. b Distribution of cell types before the initiation of the in silico trial over 1000 simulated patients (rows). c Conventional (top) and proposed (bottom) dose-escalation schedules to identify the MTD in a phase I study. d Comparison in outcomes of different schedules identified by their dacomitinib and osimertinib doses on the axes; the y axis is median improvement percentage of 30 mg QD of dacomitinib and 40 mg BID of osimertinib (proposed level 3 schedule) relative to each dose combination is shown after 1 year of treatment. e, f Waterfall plots with the relative improvement percentage of our proposed schedules compared to the conventional schedules after 8 weeks (2 treatment cycles) and 1 year of treatment, respectively, for 100 patients.

