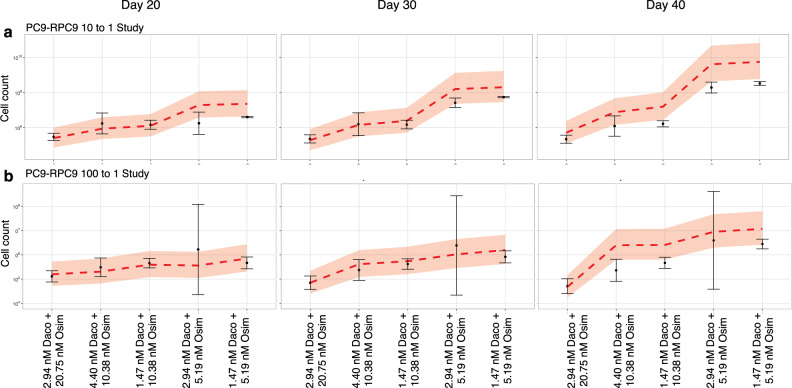
Fig. 4. Longitudinal validation experiments in mixed cell pools at days 20, 30, and 40 of treatment.
Predictions and interquartile ranges from mathematical modeling predictions are shown in a dashed red line and shaded regions, respectively. Observations with two standard errors are shown in black dots and error bars, respectively. The RPC9 (RPC9-CL6) clone is composed of 90% exon 19 del cells 10% exon 19 del and T790M alleles. a PC9-RPC9 cell pool in 10–1 ratio. Our predictions ranked schedules correctly, detecting a difference between the two best schedules at day 30 (p = 0.0159, two-sided t-test with n = 6 biological samples). b PC9-RPC9 cell pool in 100–1 ratio. Our predictions ranked schedules correctly except for the worst 2 schedules, but the difference between the schedules was not statistically significant in the observed data (p = 0.294, two-sided t-test with n = 6 biological samples). Source data are provided as a Source Data file.

