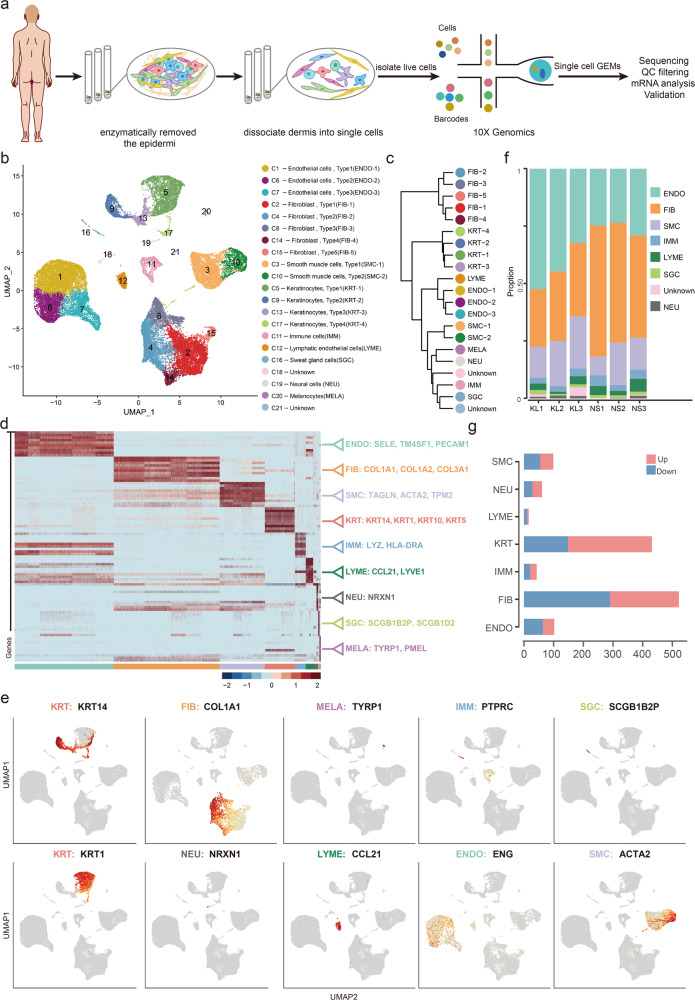
Fig. 1. Single-cell RNA-seq reveals heterogeneity of normal scar and fibrotic skin disease dermis tissues.
a Illustration of workflow of scRNA-seq in human normal scar and fibrotic skin disease dermis samples. b Unbiased clustering of 40655 cells reveals 21 cellular clusters. Clusters are distinguished by different colors. The general identity of each cell cluster is shown on the right. c Unsupervised hierarchical clustering of average gene expression showing relatedness of cell clusters (correlation distance metric, average linkage). d Heatmap of differentially expressed genes. For each cluster, the top 10 genes and their relative expression levels in all sequenced cells are shown. Selected genes for each cluster are color-coded and shown on the right. e Feature plots of expression distribution for selected cluster-specific genes. Expression levels for each cell are color-coded and overlaid onto the UMAP plot. f The proportion of cell lineages in keloids (KL) and normal scars (NS). g Number of differentially expressed (DE) genes in each cell type with >100 cells available in keloid and normal scars (two-sided Wilcoxon Rank Sum test, Bonferroni correction, log fold change (FC) cutoff of 0.5, and adjusted P-value of <0.05). Red bars indicate upregulated genes, and blue bars indicate downregulated genes in keloid.

