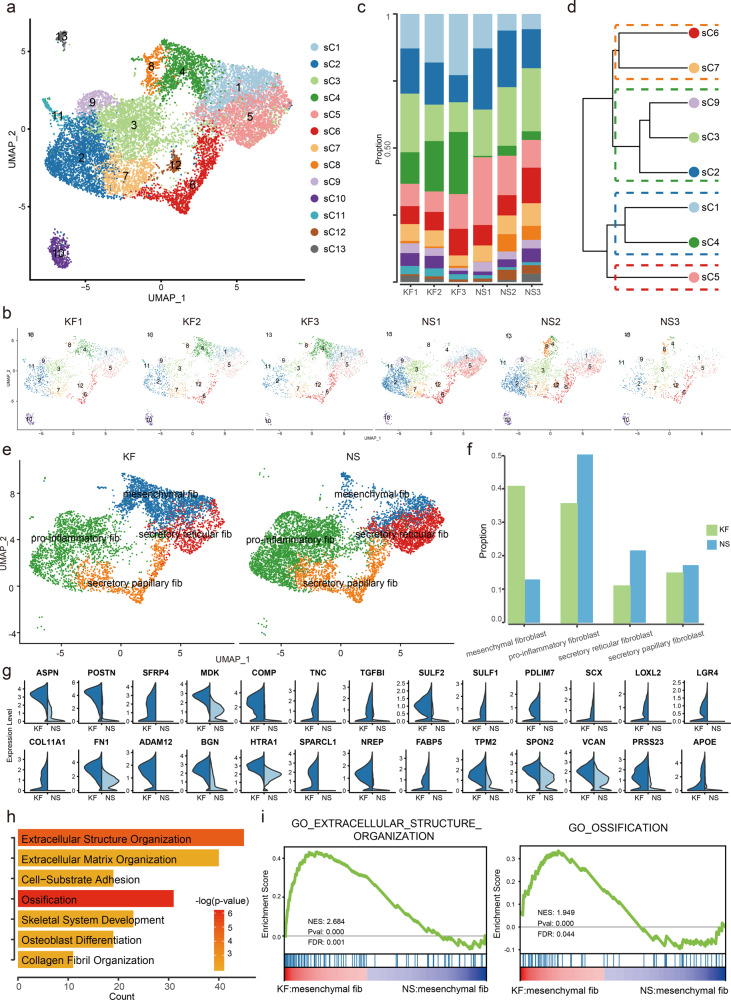
Fig. 2. Keloid and normal scar fibroblasts subcluster into distinct cell populations.
a, b Subclustering of keloid and normal scar fibroblasts (cells from clusters C2, C4, C8, C14, and C15 shown in Fig. 1) further identified 13 distinct subtypes. Color-coded UMAP plot is shown and each fibroblast subcluster (sC1 through sC13) is defined on the right. KF: keloid fibroblasts, NS: normal scar fibroblasts. c Cell proportions of fibroblast subclusters in keloids and normal scars. Cells of sC4 were significantly increased in keloid samples compared to normal scar samples. d Unsupervised hierarchical clustering showing relatedness of fibroblast subclusters (Euclidean distance metric, average linkage). e Keloid and normal scar fibroblasts could be divided into 4 subpopulations: secretory-papillary, secretory-reticular, mesenchymal, and pro-inflammatory. f The proportions of 4 fibroblast subpopulations in keloid and normal scar. g Violin plots showing representative differentially expressed genes between keloid mesenchymal fibroblasts and normal scar mesenchymal fibroblasts. h GO Biological Process enrichment analysis of differentially expressed genes in mesenchymal fibroblasts between keloid and normal scars. i GSEA enrichment plots for representative signaling pathways upregulated in keloid mesenchymal fibroblasts compared to normal scars.

