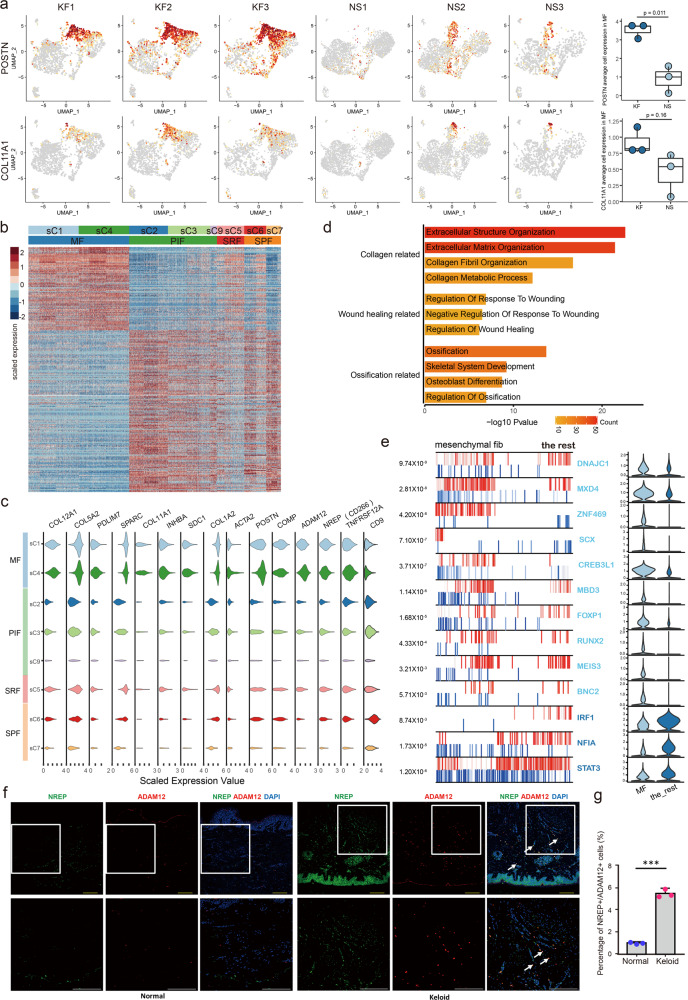
Fig. 3. Characteristics of mesenchymal fibroblasts in fibrotic skin disease.
a Feature plots of the expression distribution for POSTN and COL11A1 in keloid fibroblasts (KF) and normal scar fibroblasts (NS). Expression levels for each cell are color-coded and overlaid onto the UMAP plot. The average cell expression of each gene in mesenchymal fibroblasts between KF and NS were shown in the right panel (Two-sided unpaired t-test). n = 3 biologically independent samples. In box plots, lines in the middle of boxes correspond to median values. Lower and upper hinges correspond to the first and third quartiles, and the upper whisker extends from the hinge to the largest value no further than 1.5 × IQR (inter-quartile range) from the hinge. The lower whisker extends from the hinge to the smallest value at most 1.5 × IQR of the hinge. b Heatmap of differentially expressed genes in each fibroblast subpopulations. MF: mesenchymal fibroblast, PIF: pro-inflammatory fibroblast, SRF: secretory-reticular fibroblast, SPF: secretory-papillary fibroblast. c Violin plots illustrating the expression of some marker genes in each fibroblast subpopulations. d Functional enrichment of upregulated genes in mesenchymal fibroblasts [Fisher exact-test, corrected for multiple comparisons using Benjamini and Hochberg method, adjusted P-value of <0.05]. e The top 13 candidate master regulators for mesenchymal fibroblasts identified by an algorithm for master regulator analysis algorithm (MARINa). Violin plots showing the relative expression levels of each master regulator in the right panel. f Immunofluorescence staining of NREP and ADAM12 in normal and keloid tissues. Lower panels are the insets of upper panels. Arrowheads indicate NREP+/ADAM12+ cells. Scale bar = 200 μm. g Percentage of NREP+/ADAM12+ cells in normal and keloid tissues. Data are presented as mean values ± SD (n = 5 images examined over 3 independent experiments). Two-sided unpaired t-test, ***P = 0.00013.

