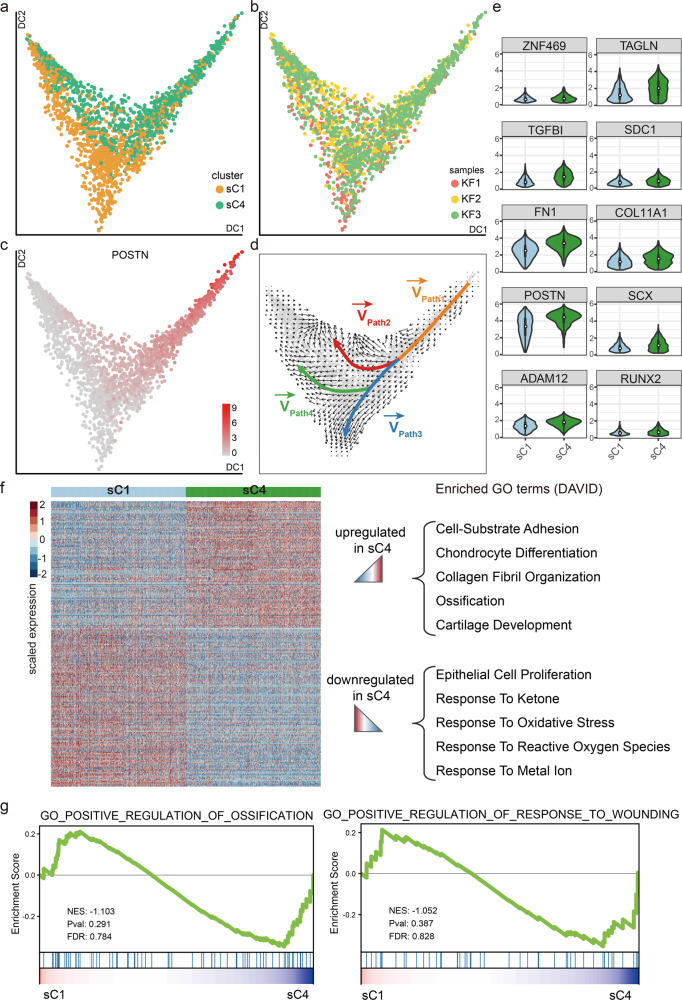
Fig. 6. sC4 fibroblasts are more mesenchymal-like than sC1 fibroblasts.
a, b Results of diffusion-pseudotime analysis of keloid mesenchymal fibroblasts, colored by subcluster (a) and by keloid samples (b). c Diffusion map showing the expression levels of POSTN in keloid mesenchymal fibroblasts. Red indicates maximum relative expression, and gray indicates low or no expression of this gene. d RNA velocity analysis distinguished four sets of velocity vectors across the diffusion-pseudotime: Path1 (orange), Path2 (red), Path3 (blue), and Path4 (green). e The difference in the expression levels of mesenchymal fibroblasts population-specific genes (n = 1047 cells in keloid sC1 cluster, n = 1048 cells in keloid sC4 cluster). In embedded box plots, the white dot in the middle of boxes corresponds to median values. Lower and upper hinges correspond to the first and third quartiles, and the upper whisker extends from the hinge to the largest value no further than 1.5 × IQR (inter-quartile range) from the hinge. The lower whisker extends from the hinge to the smallest value at most 1.5 × IQR of the hinge. f Heatmap showing differentially expressed genes among the subclusters in mesenchymal fibroblasts, and functional annotations of those dysregulated genes are shown in the right panel. g GSEA enrichment plots for representative signaling pathways upregulated in the sC4 subcluster (NES normalized enrichment score, corrected for multiple comparisons using FDR method, P-value were showed in plots).

