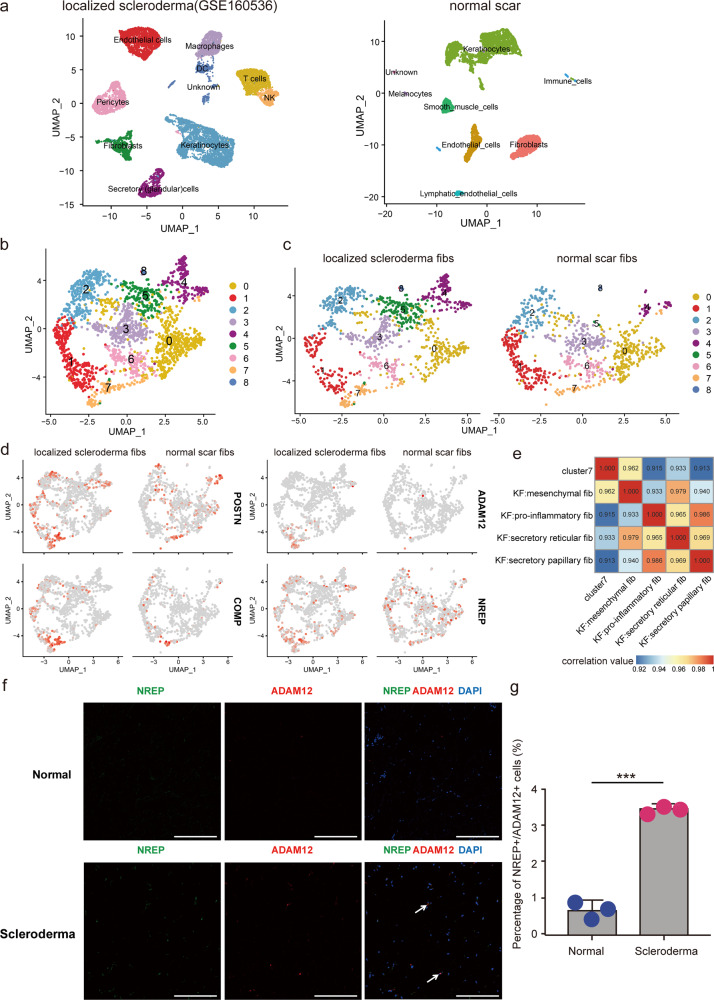
Fig. 7. Mesenchymal fibroblasts are increased in scleroderma.
a UMAP visualization of dermal skin cell populations of patients with scleroderma (data from NCBI Gene Expression Omnibus (GSE160536)) in the left panel, and a normal scar (NS3) sample from our data is showed on the right. b Integration analysis of two sources of fibroblasts, one from scleroderma, and the other one from a normal scar. c Divided UMAP visualization of the integration results. d Feature plots of the expression distribution of mesenchymal signature genes in scleroderma and normal scar fibroblasts. e Correlation analysis of the average expression level of cluster 7 cells (scleroderma) and four types of fibroblasts from keloid samples. f Immunofluorescence staining of NREP and ADAM12 in normal and scleroderma tissues. Arrowheads indicate NREP+/ADAM12+ cells. Scale bar = 200 μm. g Percentage of NREP+/ADAM12+ cells in normal and scleroderma tissues. Data are presented as mean values ± SD (n = 5 images examined over 3 independent experiments). Two-sided unpaired t-test, ***P = 0.00013.

