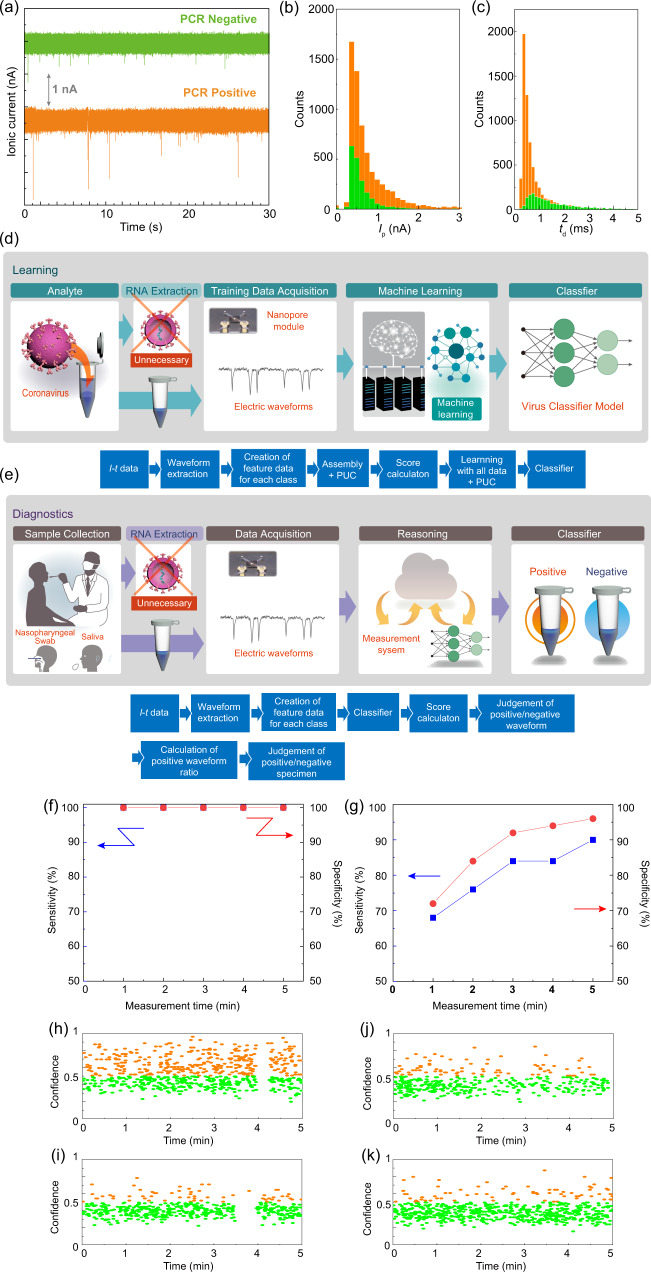
Fig. 3. Learning and diagnosis of clinical specimens.
Both processes do not require RNA extraction from the virus. a Ionic current–time traces of the PCR-positive and PCR-negative saliva specimens. b, c Histograms of Ip and td of saliva specimens. The color code corresponds to a. Ip and td show the peak current and duration of the current of an ionic current waveform, respectively. d Learning process of PCR-positive and PCR-negative saliva specimens using the learning algorithm. In all, 40 PCR-positive and 40 PCR-negative saliva samples were used for learning. e Diagnosis process of PCR-positive and PCR-negative saliva specimens utilizing the learning algorithm. In all, 50 PCR-positive and 50 PCR-negative saliva samples were used for learning. Time-dependent sensitivity and specificity of saliva specimens in f the learning process and g diagnostic process. The blue and red dots indicate sensitivity and specificity, respectively. Time dependence of the waveform confidence for clinical saliva specimens in the diagnostic process that showed h true positive (#4378), i true negative (#4423), j false positive (#4420), and k false negative (#4385), respectively. Sample identification numbers correspond to the errata in Supplementary Data 2. Orange and green circles indicate the positive and negative waveforms, respectively. Source data of a–c and f–k are provided as a Source Data file.

