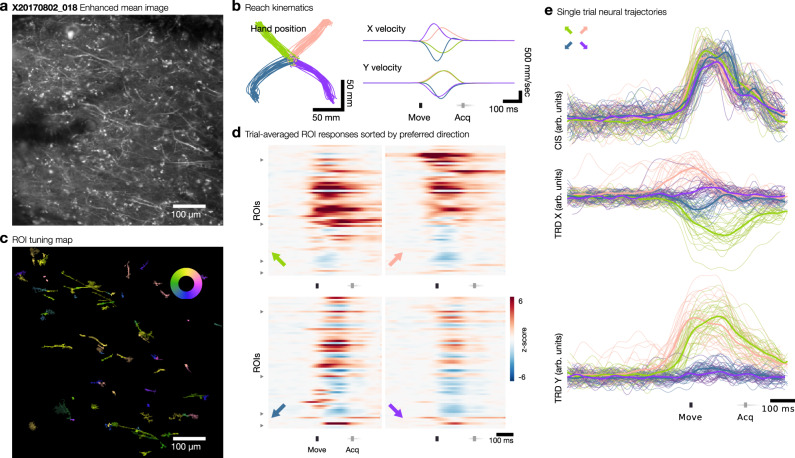
Fig. 5. Functional responses during reaching behavior.
a Contrast enhanced mean image of example FOV from Monkey X, site 2, one of 36 analyzed imaging sessions. b Reaching kinematics observed during behavioral task. Move indicates movement onset; Acq indicates target acquisition. c ROI tuning map showing preferred direction of ROIs with significant direction tuning. Inset color wheel indicates reach direction. d Trial-averaged responses of dendritic ROIs, normalized to baseline fluorescence, for the four reaching directions indicated by the colored arrow in the bottom left of each raster. ROIs are sorted by preferred direction beginning with rightwards and proceeding counterclockwise; triangular ticks at left edge indicate locations of preferred directions of up-right, up-left, down-left, down-right. e Single-trial (thin lines) and trial-averaged (thick lines) population trajectories aligned to behaviorally-defined movement onset, projected along condition-independent signal (CIS) dimension and condition-dependent TDR X and Y dimensions (see “Methods” section), color coded by reach direction condition.

