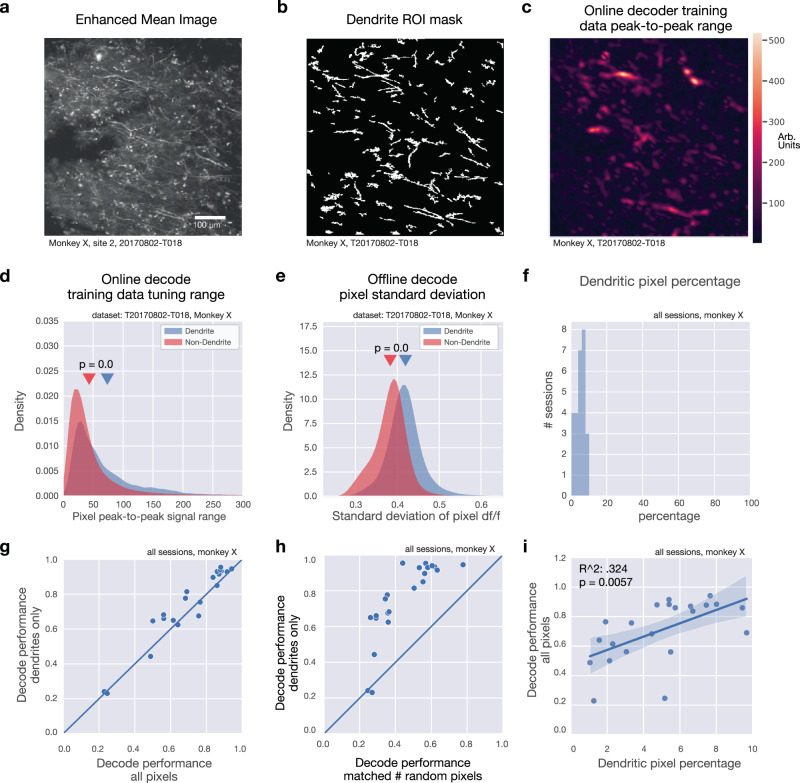
Fig. 7. Dendritic signals drive online decode.
a Mean intensity projection (contrast enhanced) for example imaging session (one of 36 sessions shown), b Dendrite ROI pixel mask for example in a. c Peak-to-peak pixel signal range across four reach directions for the online imaging decoder training data for example in a. Large values indicate large modulation and higher variability across different reach directions. d Comparison of distributions of pixel peak-to-peak range between dendritic pixels and non-dendritic pixels (rank-sum test, U statistic = 78.6356, p = 0.0). e Comparison of distributions of standard deviation of pixel df/f value across all timepoints and across reach directions between dendritic pixels and non-dendritic pixels (rank-sum test, U statistic = 113.6273, p = 0.0). f Histogram of percentage of pixels inside a dendritic ROI for all sessions, monkey X. g Comparison of offline decode performance using dendritic pixels only (ordinate) vs. all pixels (abscissa). h Comparison of offline decode performance using dendritic pixels only (ordinate) vs. a random selection of the same number of pixels as those within dendritic ROIs. i Decode performance as a function of the percentage of pixels associated with a dendritic ROI for each session. Blue line represents regression fit; shaded area indicates 95% confidence interval.

