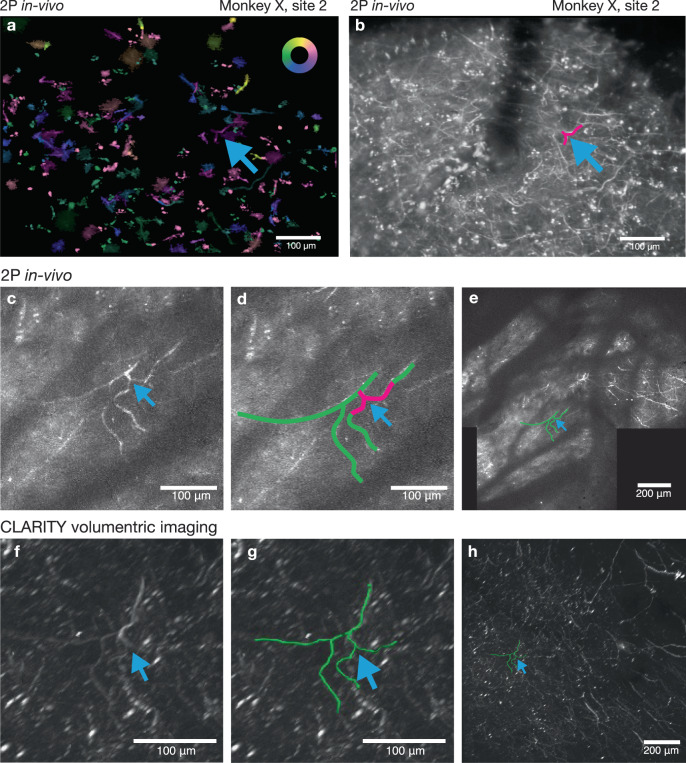
Fig. 9. A second example of a neural process functionally imaged and reconstructed in the registered CLARITY volume.
a Pixel-wise tuning map, same FOV and presentation style as in Fig. 4h (Inset color wheel indicates reach direction). A neural feature of interest is indicated by the blue arrow. b. Mean intensity projection of FOV in a. The same process is labeled with a blue arrow. This image represents only a thin slice through the tissue volume. c Maximum intensity projection from in vivo volumetric z-stack showing projection of the neural features labeled in a and b. More structure is present in this image than in b, since this image is a maximum intensity projection of images acquired at multiple depths. d Same image as c, with the neural feature of interest from a–c traced in green. e Maximum intensity projection of stitched 3D volume assembled from in vivo 2P imaging. f Closeup view of ex vivo imaged CLARITY volume. The neural feature from a–e is marked with the blue arrow. g Same as f with the feature from a–e traced in green. h Wide view of CLARITY volume. Data from Monkey X, injection site 2.

