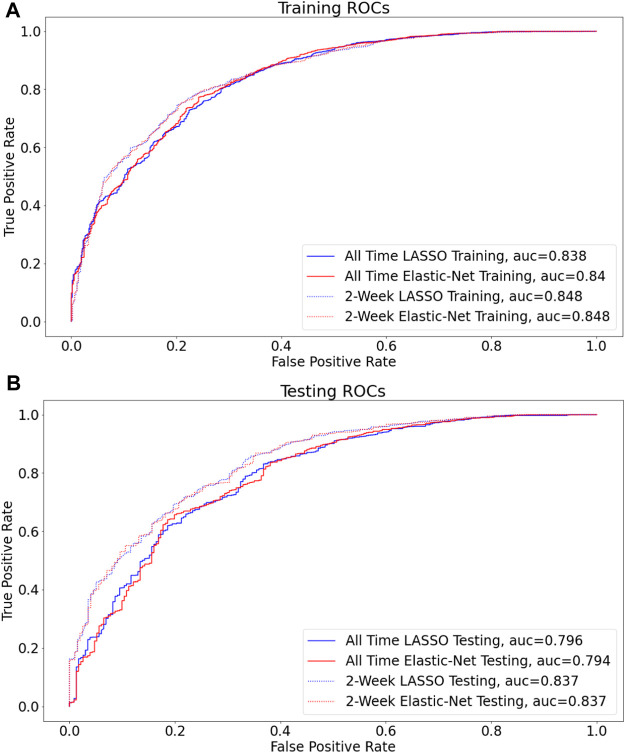
FIGURE 2.
LASSO vs Elastic-Net model performance on two sets of data Receiver operating characteristic (ROC) curves are shown for the final model for each of the four assessed techniques (A,B), and the corresponding areas under curves (AUC) are presented in the figure legend. By AUC on hold out data (0.815), the models built on data filtered by two-week before COVID (non)diagnosis perform the best (B).

