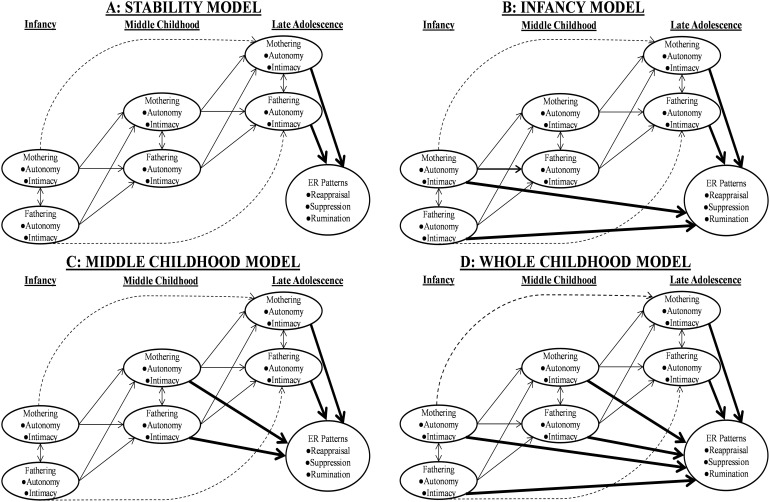
FIGURE 1.
The Hypothetical Developmental Timing Models, including the Stability Model (A), Infancy Model (B), Middle Childhood Model (C), and Whole Childhood Model (D). The bolded paths represent the paths of our main interests. The non-bolded unbroken paths represent the first-order autoregressive and cross-lagged paths and concurrent correlations of mothering and fathering. The dotted paths represent the potential second-order temporal stability paths of the mothering and fathering. ER = emotion regulation.

