FIGURE 7.
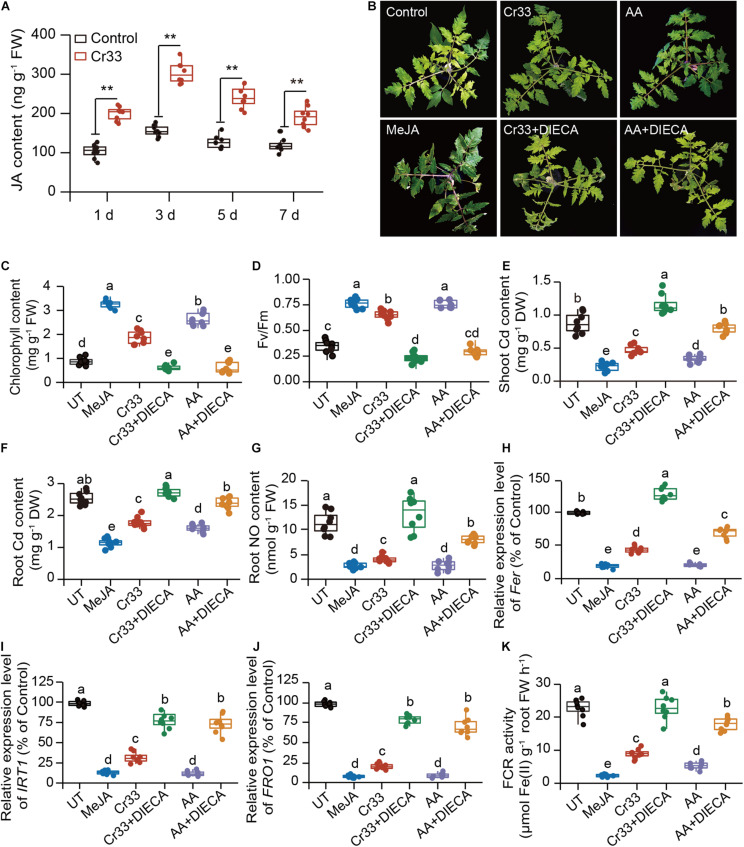
Involvement of JA signals in the L. fusiformis Cr33-induced Cd resistance in tomato plants. (A) Root JA content within 7 d of Cd treatment. Asterisks indicated significant differences between the non-inoculated (control) and inoculated plants (n = 8 biological replicates) using Student’s t-test (**p < 0.01). Three-weeks-old tomato plants were exposed to 100 μM Cd with or without cell suspensions of Cr33 at the final density of 5 × 10⁷ CFU mL–1, 0.15 mM acetic acid (AA), 0.05 mM MeJA, Cr33 plus 0.2 mM DIECA (Cr33 + DIECA), and 0.15 mM AA plus 0.2 mM DIECA (AA + DIECA) for 20 d. The untreated (UT) and treated plants were used to analyze shoot phenotypes (B), chlorophyll content (C), Fv/Fm values (D), shoot (E) and root (F) Cd content, root NO content (G). qPCR analyses of the expression of Fer (H), IRT1 (I) and FRO1 (J), and root FCR activity (K) after 48 h of treatments. Different letters indicated significant differences among different experimental groups (n = 8 biological replicates) using Duncan’s multiple range test at p < 0.05.

