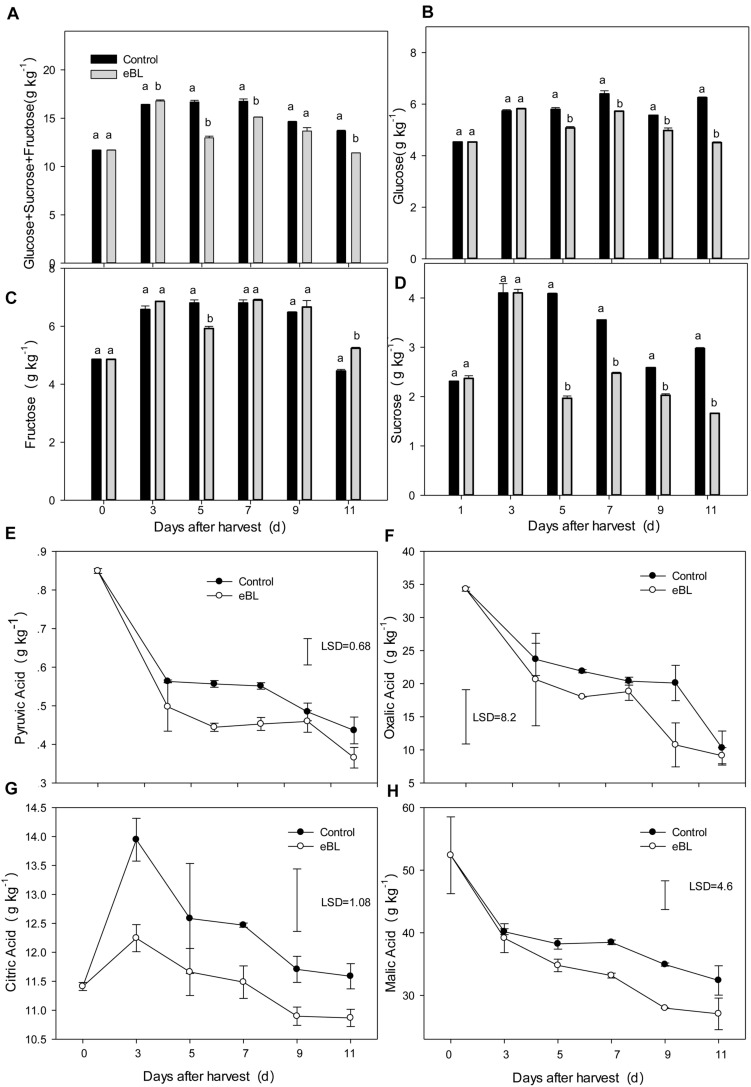
FIGURE 3.
Effects of eBL treatment on the content of sugars and organic acids. (A) The total content of glucose, fructose, and sucrose; (B–D) the total content of glucose (B), fructose (C), and sucrose (D); (E–H) the total content of pyruvic acid (E), oxalic acid (F), citric acid (G), and malic acid (H). Least significant differences (LSDs) were calculated to compare significant effects at the 5% level. Each data point represents the mean ± S.E. (n = 3).

