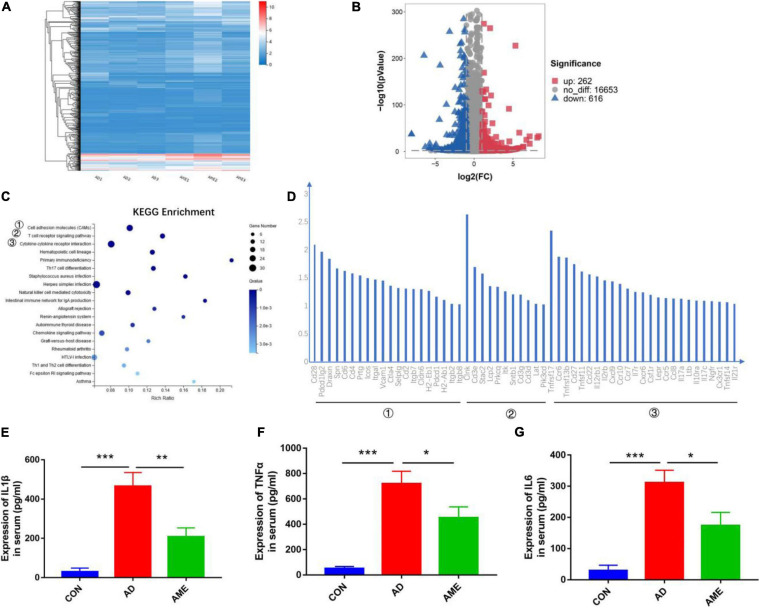
FIGURE 4.
Differential expression of genes in intestinal tumor tissues. (A) Hierarchical clustering analysis was performed according to the FPKM of each sample. (B) Volcano plot of DEGs in MSC group compared with AOM/DSS group. (C) KEGG enrichment analysis was conducted for downregulated genes in MSC group compared with AOM/DSS group. (D) Genes in the three top signaling pathways. (E–G) Expression of TNF-α, IL-1β, and IL-6 in serum was detected by enzyme-linked immune sorbent assay. *P < 0.05, **P < 0.01, ***P < 0.001. n = 3 mice per group.

