
Figure 4.
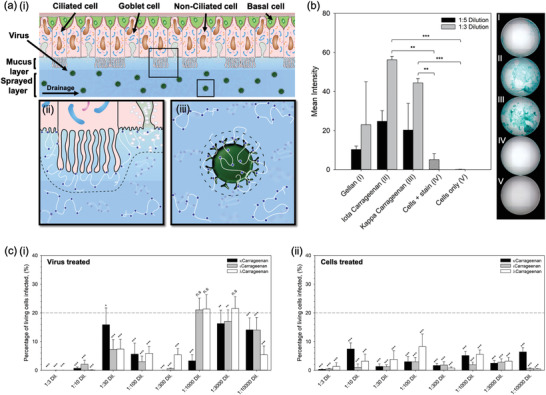
Mechanism for the inhibition of SARS‐CoV‐2. a) Schematic diagram showing the nasal epithelium covered in the nasal spray: i) demonstration of potential removal of the virus via trapping within the sprayed layer and elimination through natural nasal clearance mechanisms (sneezing/nose‐blowing/swallowing), ii) demonstration of potential blockage of virus uptake into the cells as the polymer creates a steric barrier across the cell interface, and iii) demonstration of potential inhibition of virus uptake by creating a steric barrier around the interface of the virus. b) Alcian blue stain intensity for cells treated and subsequently washed with either gellan, ι‐carrageenan or l‐carrageenan. c) In vitro SARS‐CoV‐2 assay using Vero cells to determine levels of infection after 48 h for systems treated with increasingly sulphated carrageenans (k < ι < l), by either: i) pre‐treating the virus, or ii) pre‐treating the cells (the dotted line shows the mean value for the non‐treated control, with statistical significance being a pair‐wise comparison to this data). (n.s.: not statistically different, *:p < 0.05, **:p < 0.01, and ***:p < 0.001)