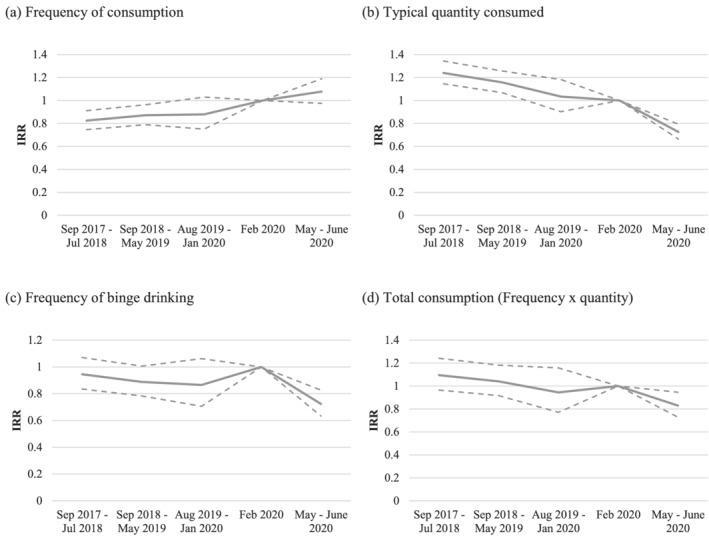
Figure 1.

Analysis of change in frequency, typical quantity, binge drinking and total consumption of alcohol consumption over time: results of negative binomial mixed effects models. Outcomes were analysed using negative binomial mixed‐effects models, with February 2020 as the reference category, and results presented as exponented coefficients corresponding to incidence rate ratios (IRRs), with bounds of 95% confidence intervals shown in dashed lines. Models are adjusted for covariates; full results are included in Supporting information, Table E2. Results are based on multiple imputation with estimates combined using Rubin's rules
