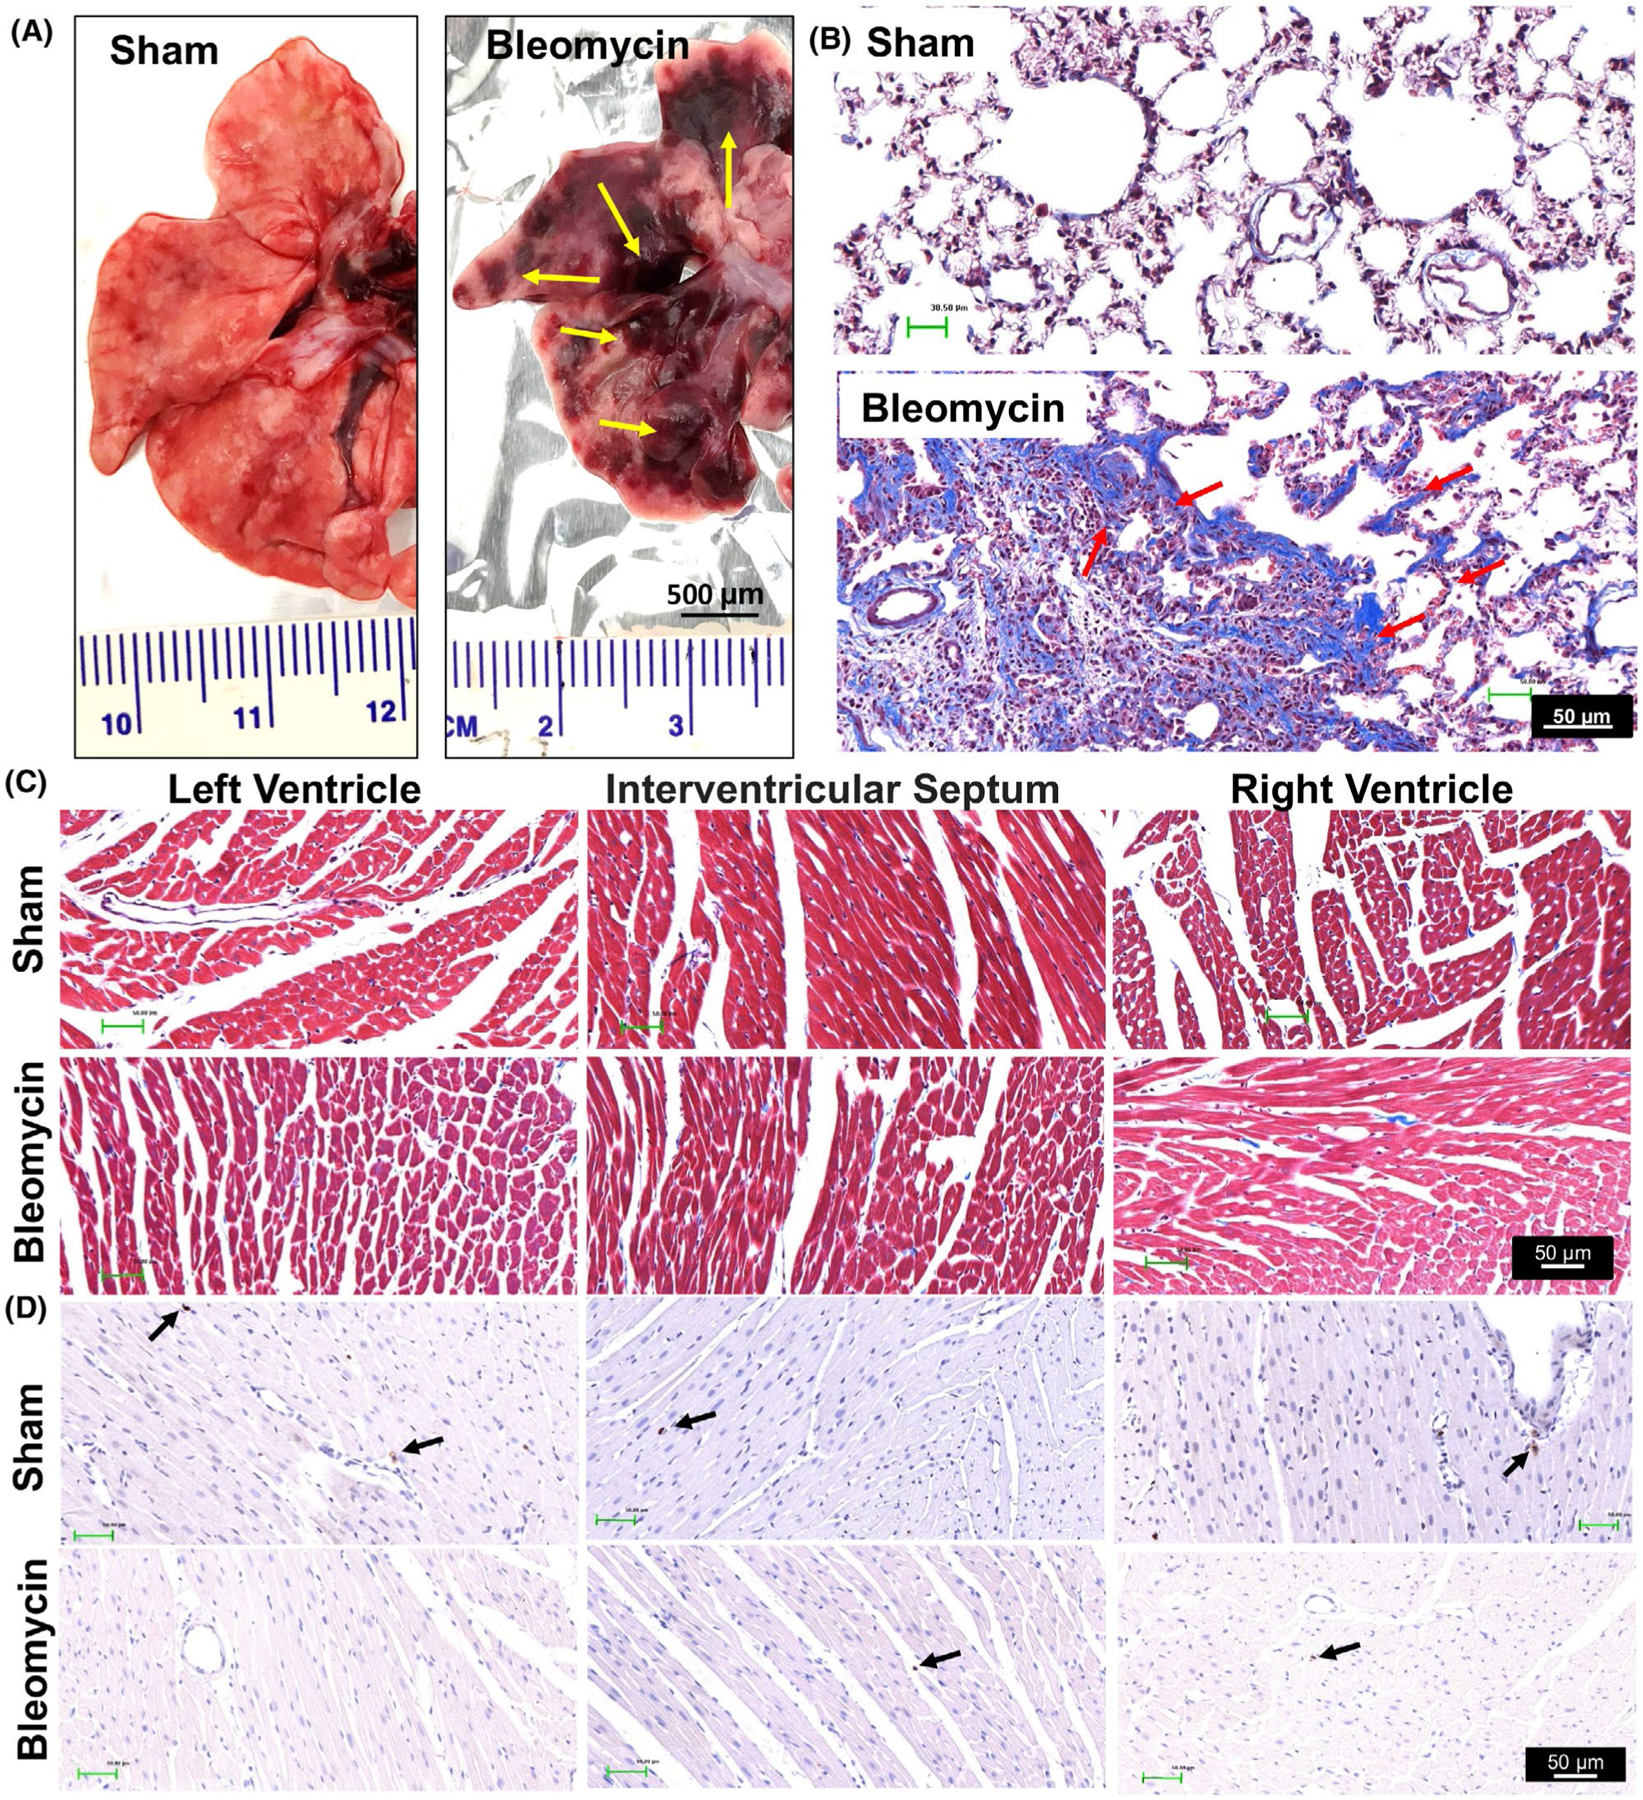
FIGURE 1.

Representative histological images showing lung injury (A) and (B) and the lack of injury/inflammation in the heart (C and D) at 2-week post-bleomycin injection. Yellow arrows in Panel A point to areas of lung injury induced by bleomycin. Scale bar = 500 μm. Red arrows in Panel B point to lung fibrosis area by Masson-Trichrome staining. Black arrows in Panel D point to T cells stained by the CD3 antibody. Scale bar = 50 μm. Cardiac histological images in Panel C and D indicate that no obvious cardiac fibrosis or T-cell infiltration was developed post-bleomycin. Scale bar = 50 μm. n = 3/each group
