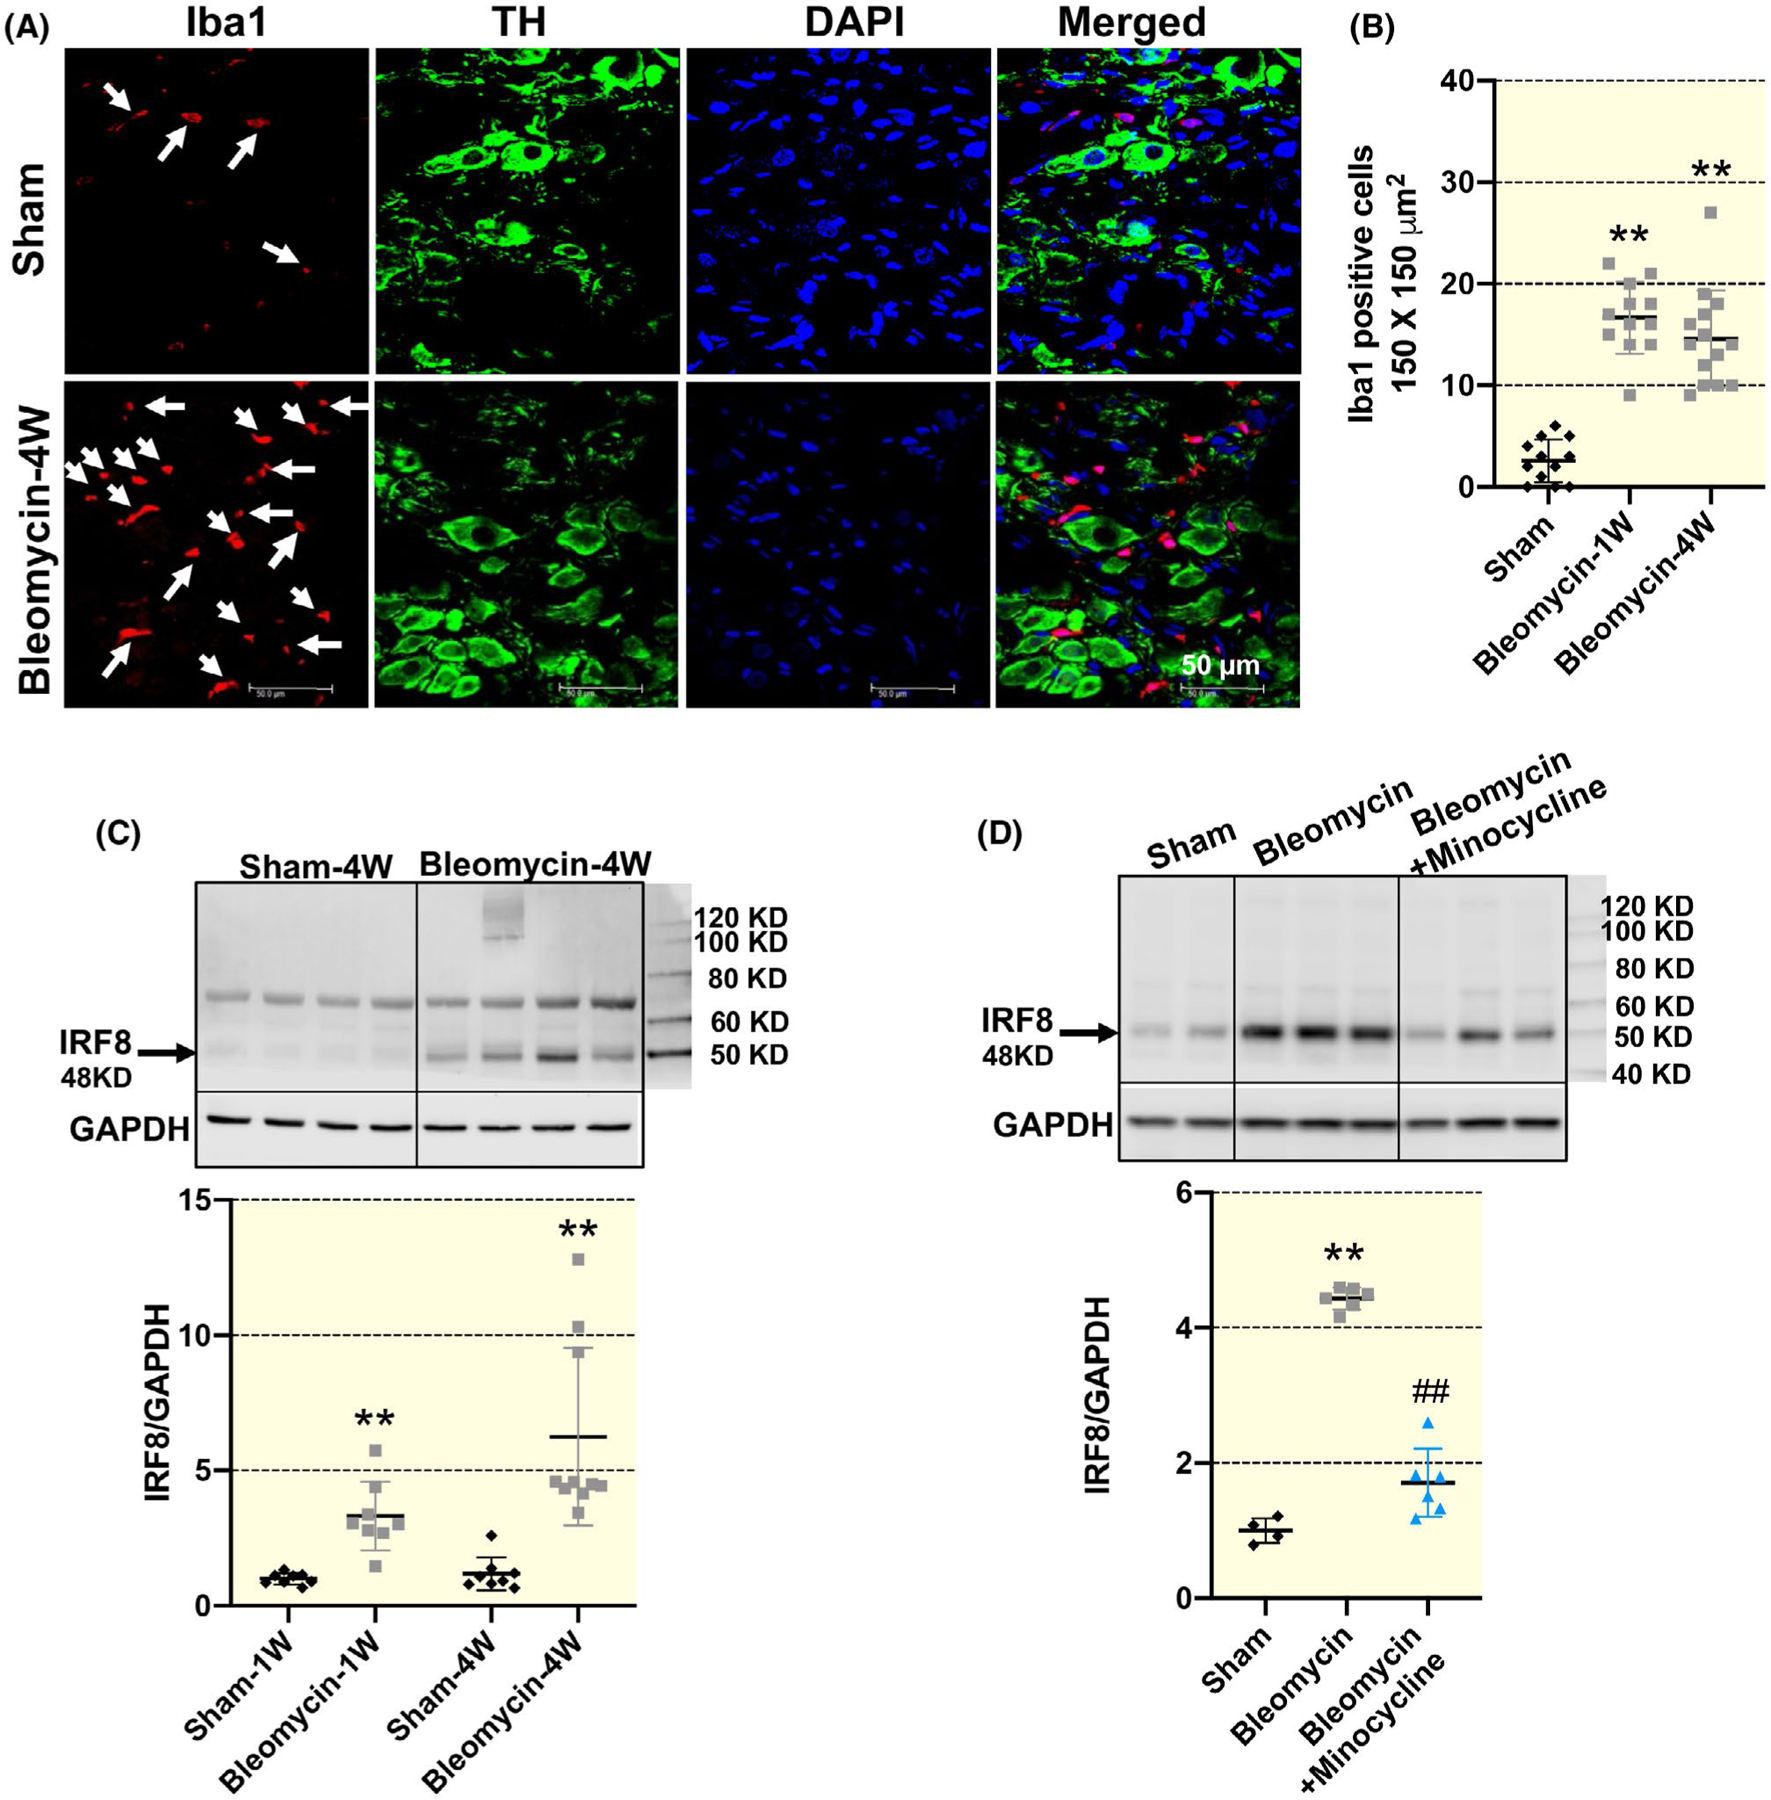
FIGURE 2.

Representative immunofluorescence images (A) and summary data (B) showing increased number of ionized calcium-binding adaptor molecule 1 (Iba1)-positive macrophages in the stellate ganglia (SG) in 1-week and 4-week bleomycin-treated rats compared with sham rats (n = 12 slices from four rats/sham and bleomycin group, n = 14 slices from four rats/bleomycin + minocycline group). Scale bar = 50 μm. TH, tyrosine hydroxylase, a SG neuron marker; DAPI, a nuclear marker. Scale bar = 50 μm. White arrows point to the Iba1-positive macrophages (red) which do not co-localize with TH-positive SG neuron. **P < .01 vs sham group. C, Representative Western blot images and mean data showing that IRF8 expression was time-dependently increased in the SGs of 1-week and 4-week bleomycin rats. n = 8/sham-1w, sham-4w, bleomycin-1w group, n = 10/bleomycin-4w group. **P < .01 versus age-matched sham group. D, Representative Western blot images and mean data showing that the increased protein expression of IRF8 in the SGs of 4-week bleomycin rats was largely prevented by minocycline. Data are expressed as mean ± SD. n = 4/sham group, n = 6/bleomycin and bleomycin + minocycline group. **P < .01 versus sham group. ##P < .01 versus 4-wk bleomycin group
