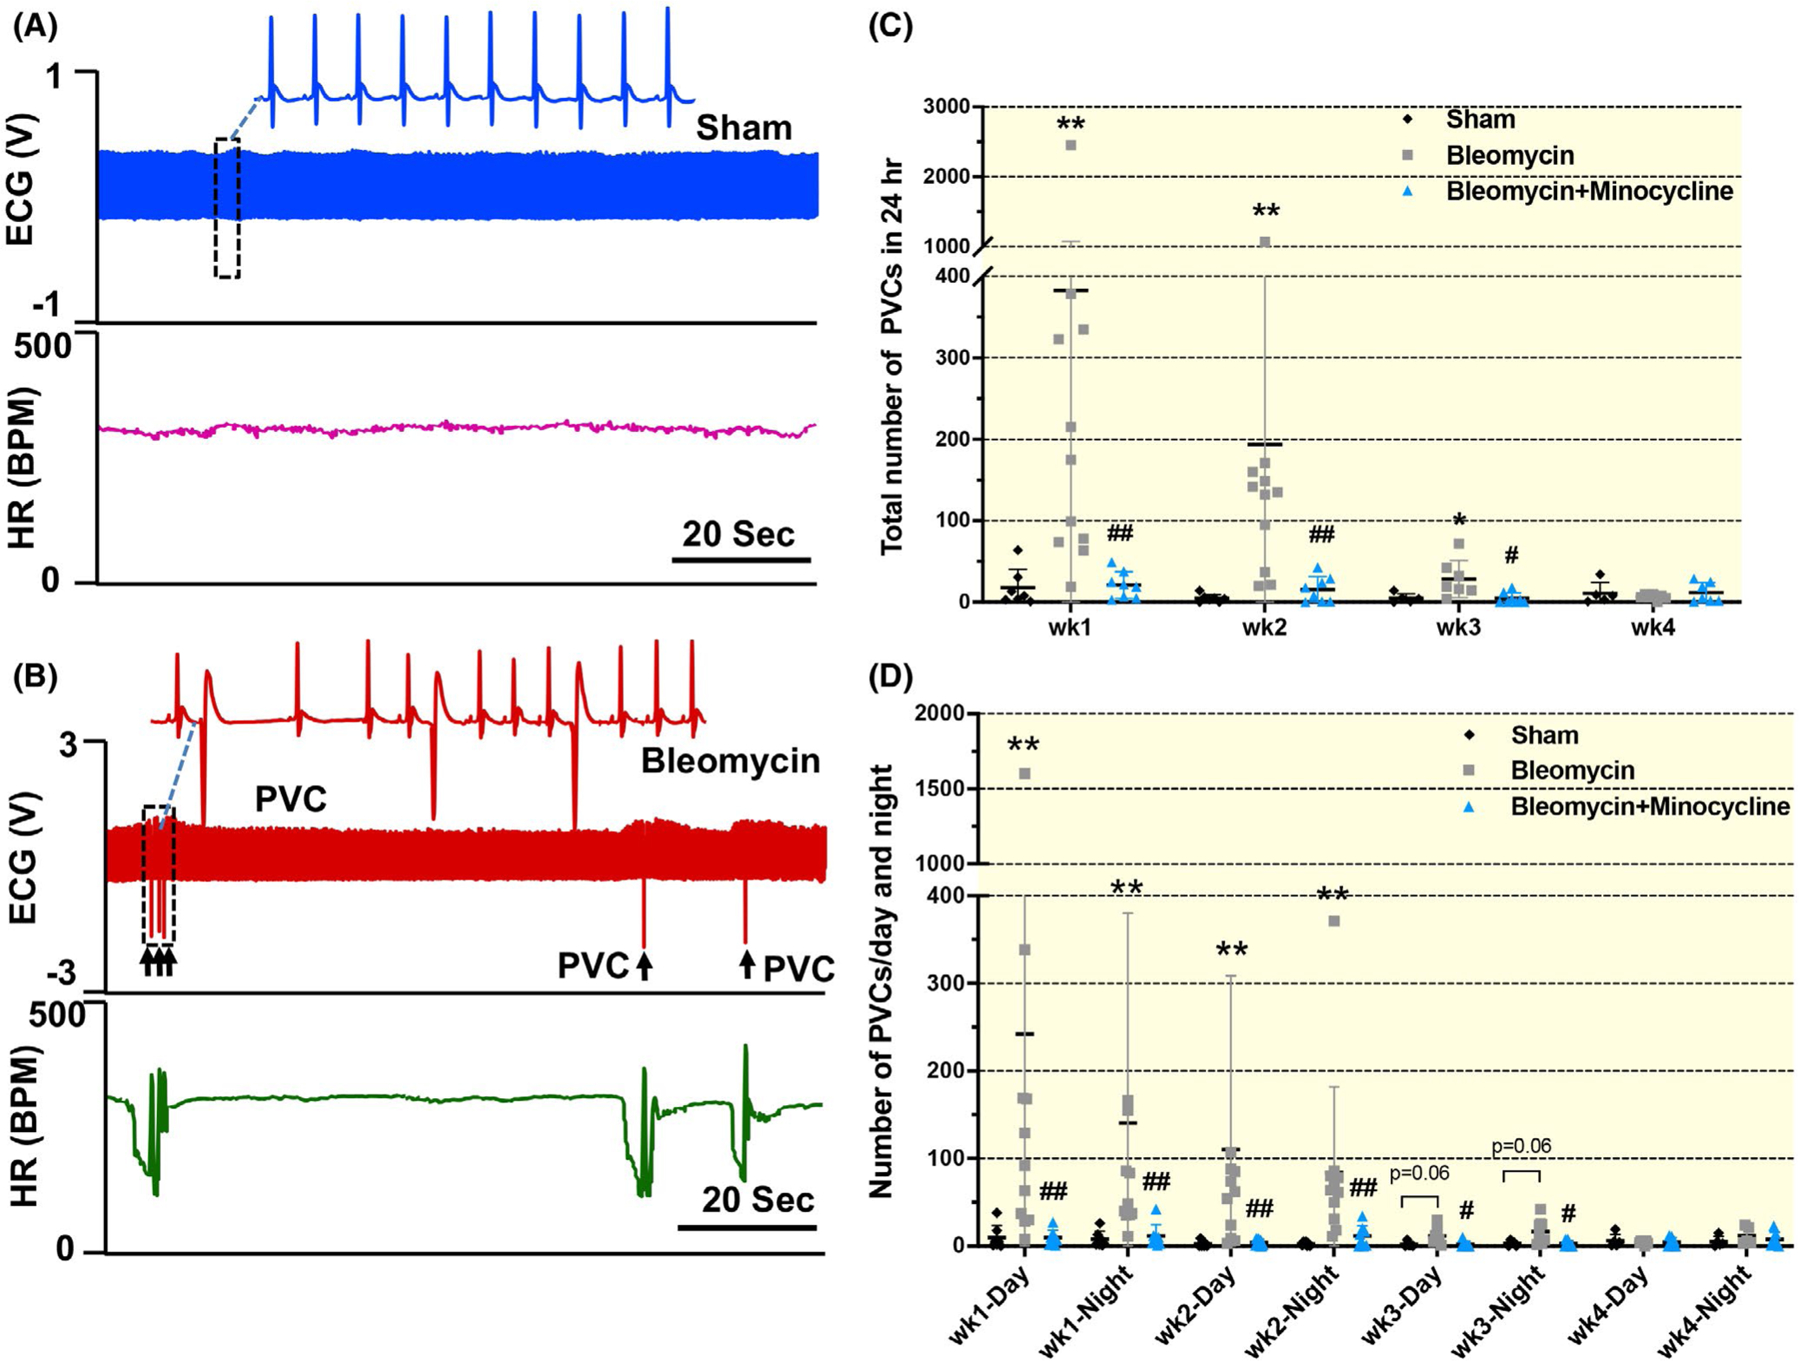
FIGURE 3.

Original tracing (A and B) and mean data (C and D) showing the number of premature ventricular contractions (PVCs) per 24 hours and their distributions over day and night in sham, bleomycin and bleomycin + minocycline rats at different time points (1, 2, 3 and 4 wk post-bleomycin). Scale bar = 20 sec. Data are expressed as mean ± SD. n = 7/sham, n = 11/bleomycin group, n = 8/bleomycin + minocycline group. **P < .01 versus sham group. #P < .05 and ## P< .01 versus bleomycin group
