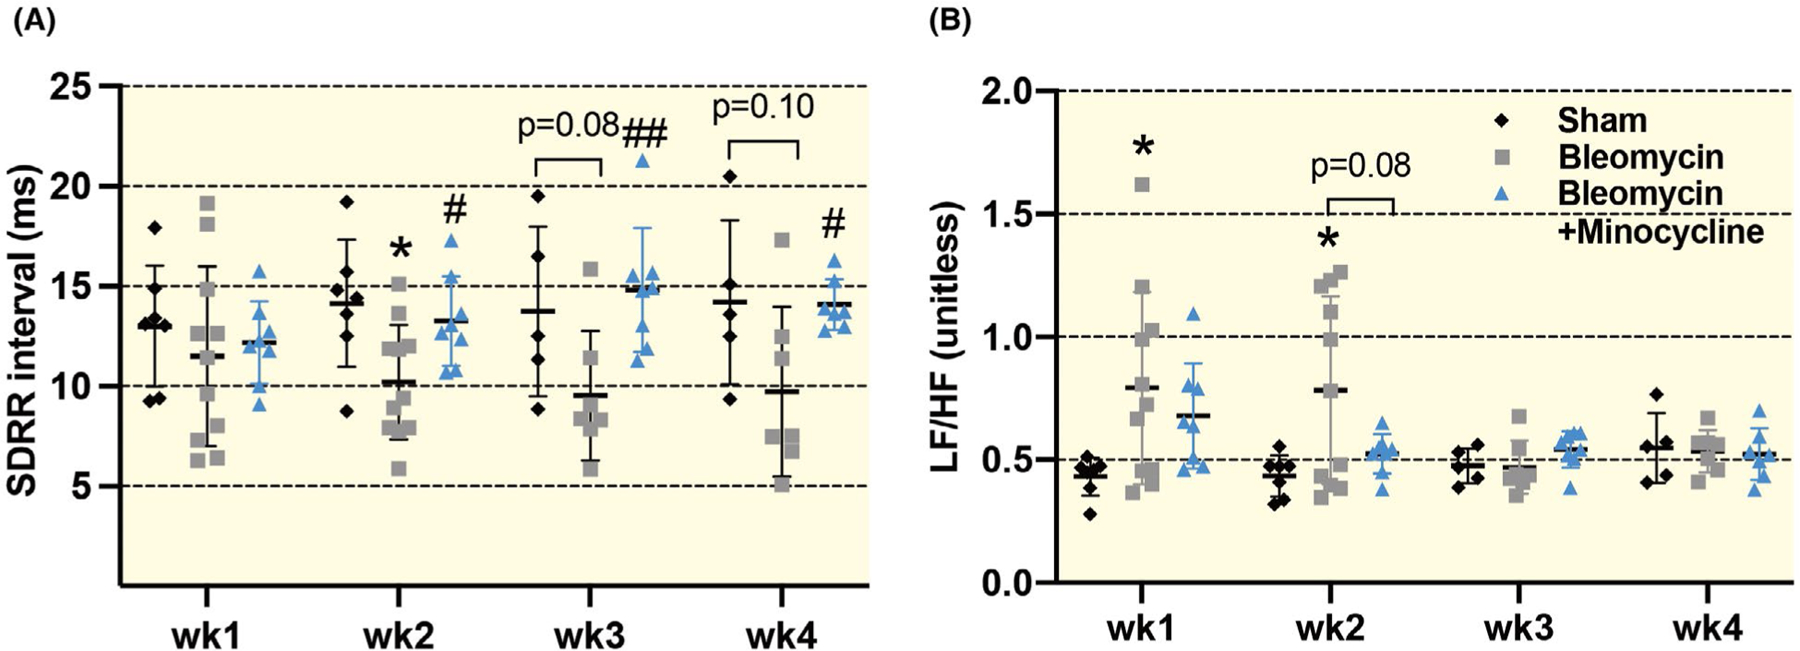
FIGURE 4.

Summarized data (A and B) showing the heart rate variability (HRV) parameters including the standard deviation of RR interval (SDRR) and low frequency/high frequency ratio (LF/HF) in sham, bleomycin and bleomycin + minocycline rats with different time points (1, 2, 3 and 4 wk post-bleomycin). Data are expressed as mean ± SD. n = 7/sham, n = 11/bleomycin group, n = 8/bleomycin + minocycline group. *P < .05 versus sham group. #P < .05 and ##P < .01 versus bleomycin group
