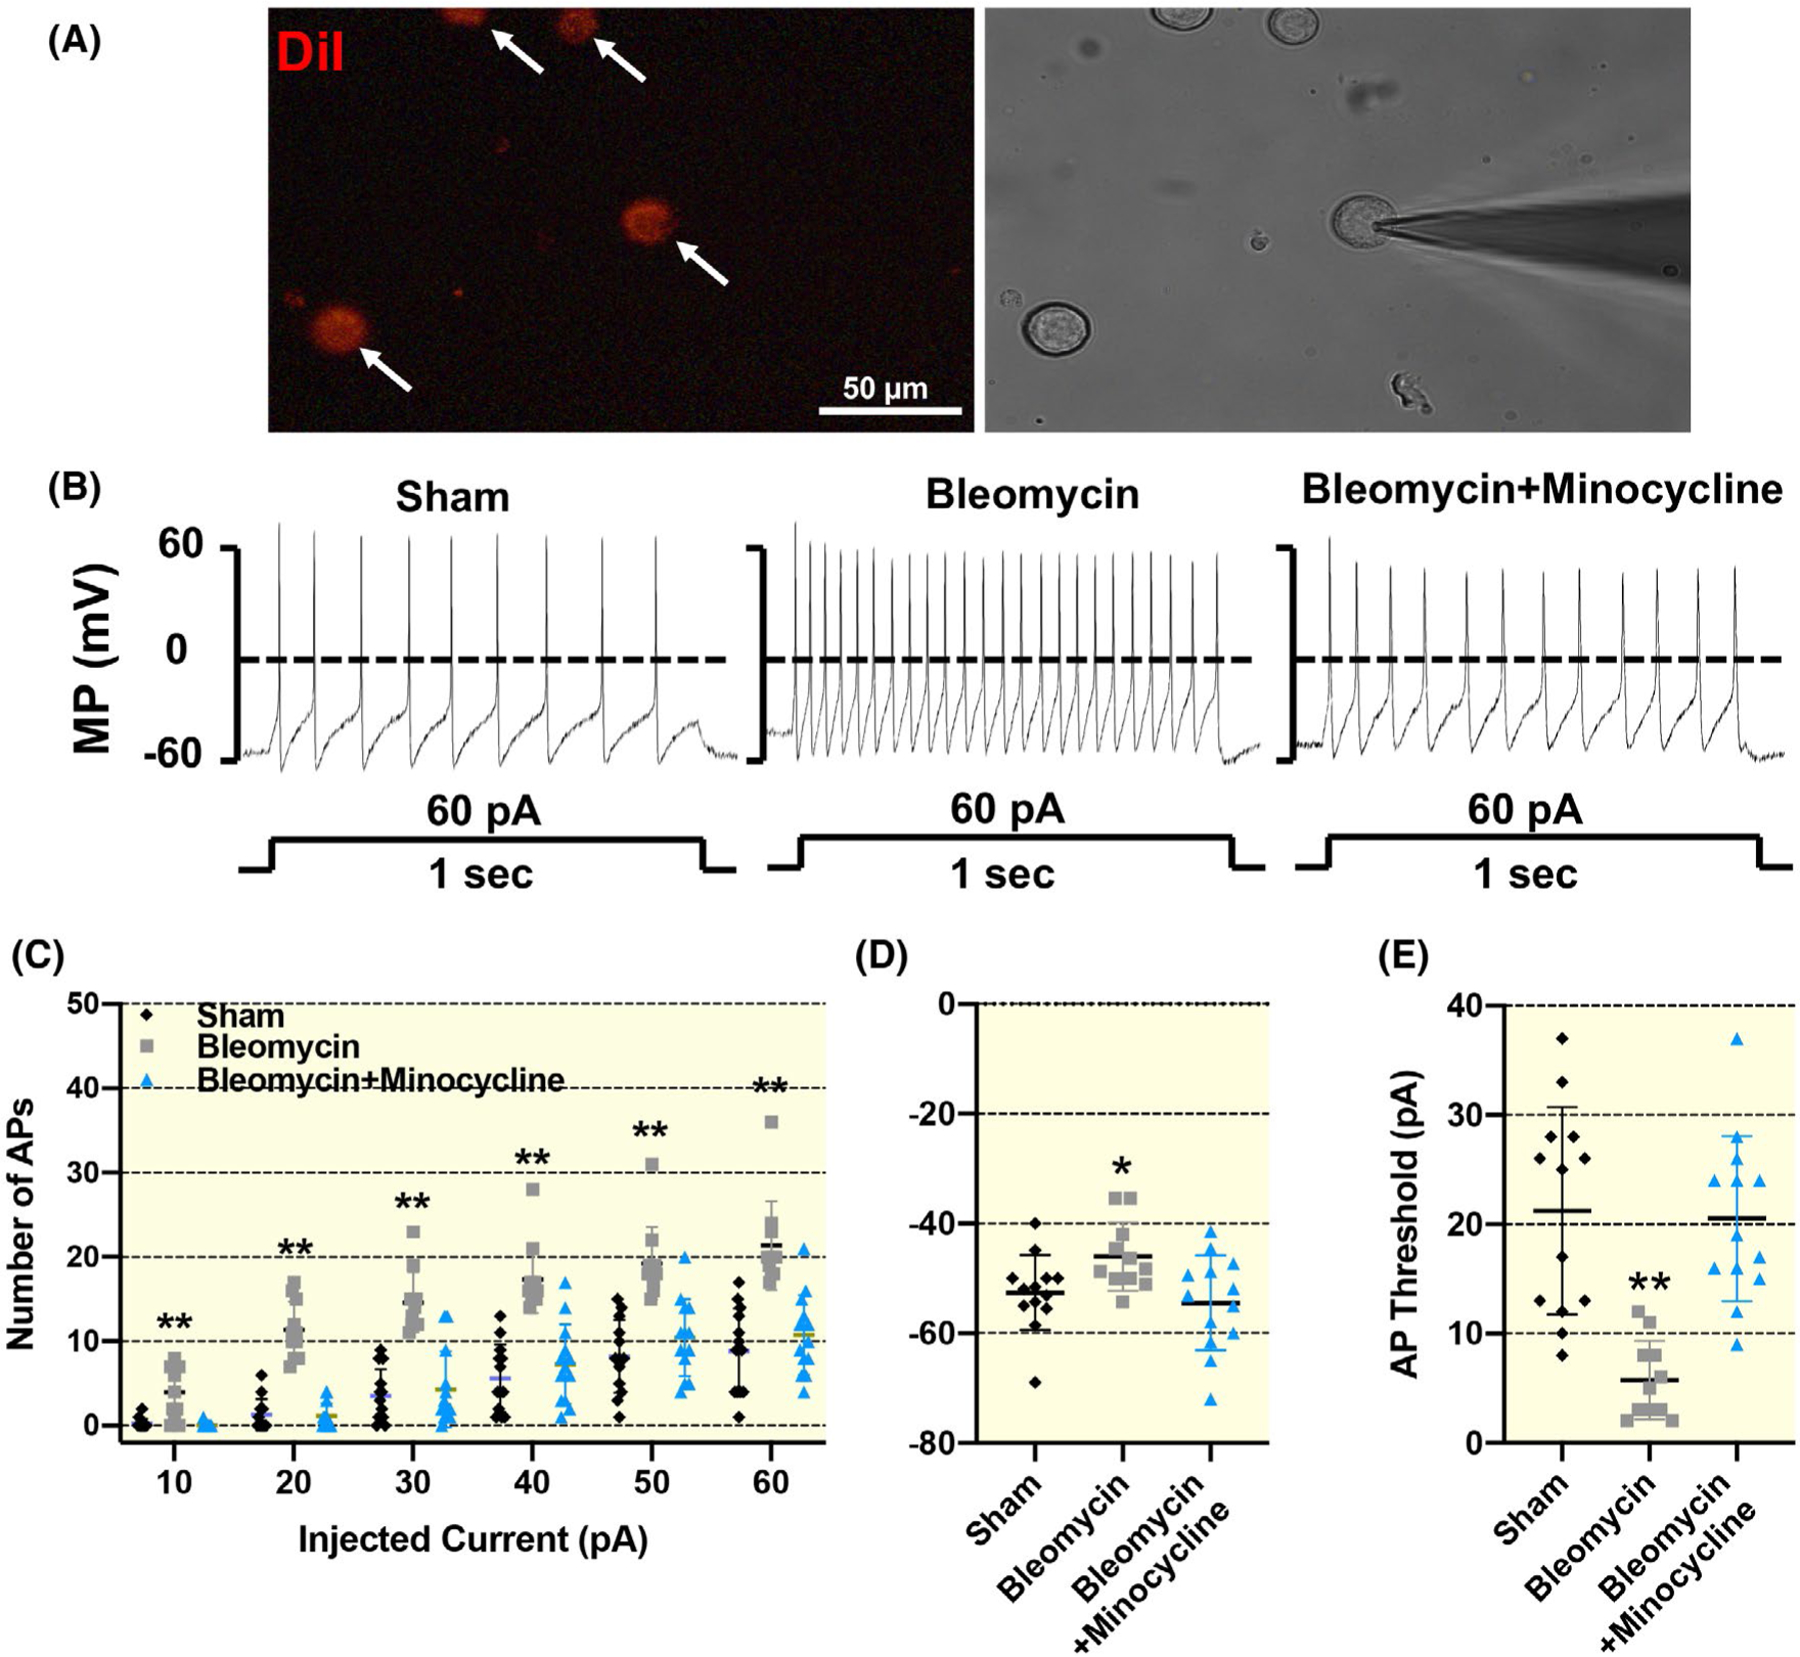
FIGURE 6.

Representative images (A and B) and summary data (C) showing increased SG neuronal excitability in 4 weeks of bleomycin rats, which was inhibited by chronic minocycline administration. A, Representative images showing how we identified cardiac efferents in the SG during patch-clamp experiments. Neuronal tracer DiI retrogradely labelled cardiac efferent SG neurons (white arrows) with red colour in fluorescent light (left) and cells in the same field under regular light. Scale bar = 50 μm. Original tracings (B) and mean data (C-E) showing action potential properties in response to both step and ramp current-injection protocols in the neuronal tracer DiI-labelled cardiac SG neurons from sham, bleomycin and bleomycin + minocycline rats. Data are expressed as mean ± SD. n = 13 neurons/sham, n = 11 neurons/bleomycin, n = 13 neurons/bleomycin + minocycline from six rats/each group. *P <.05 and **P <.01 versus both sham and bleomycin + minocycline groups
