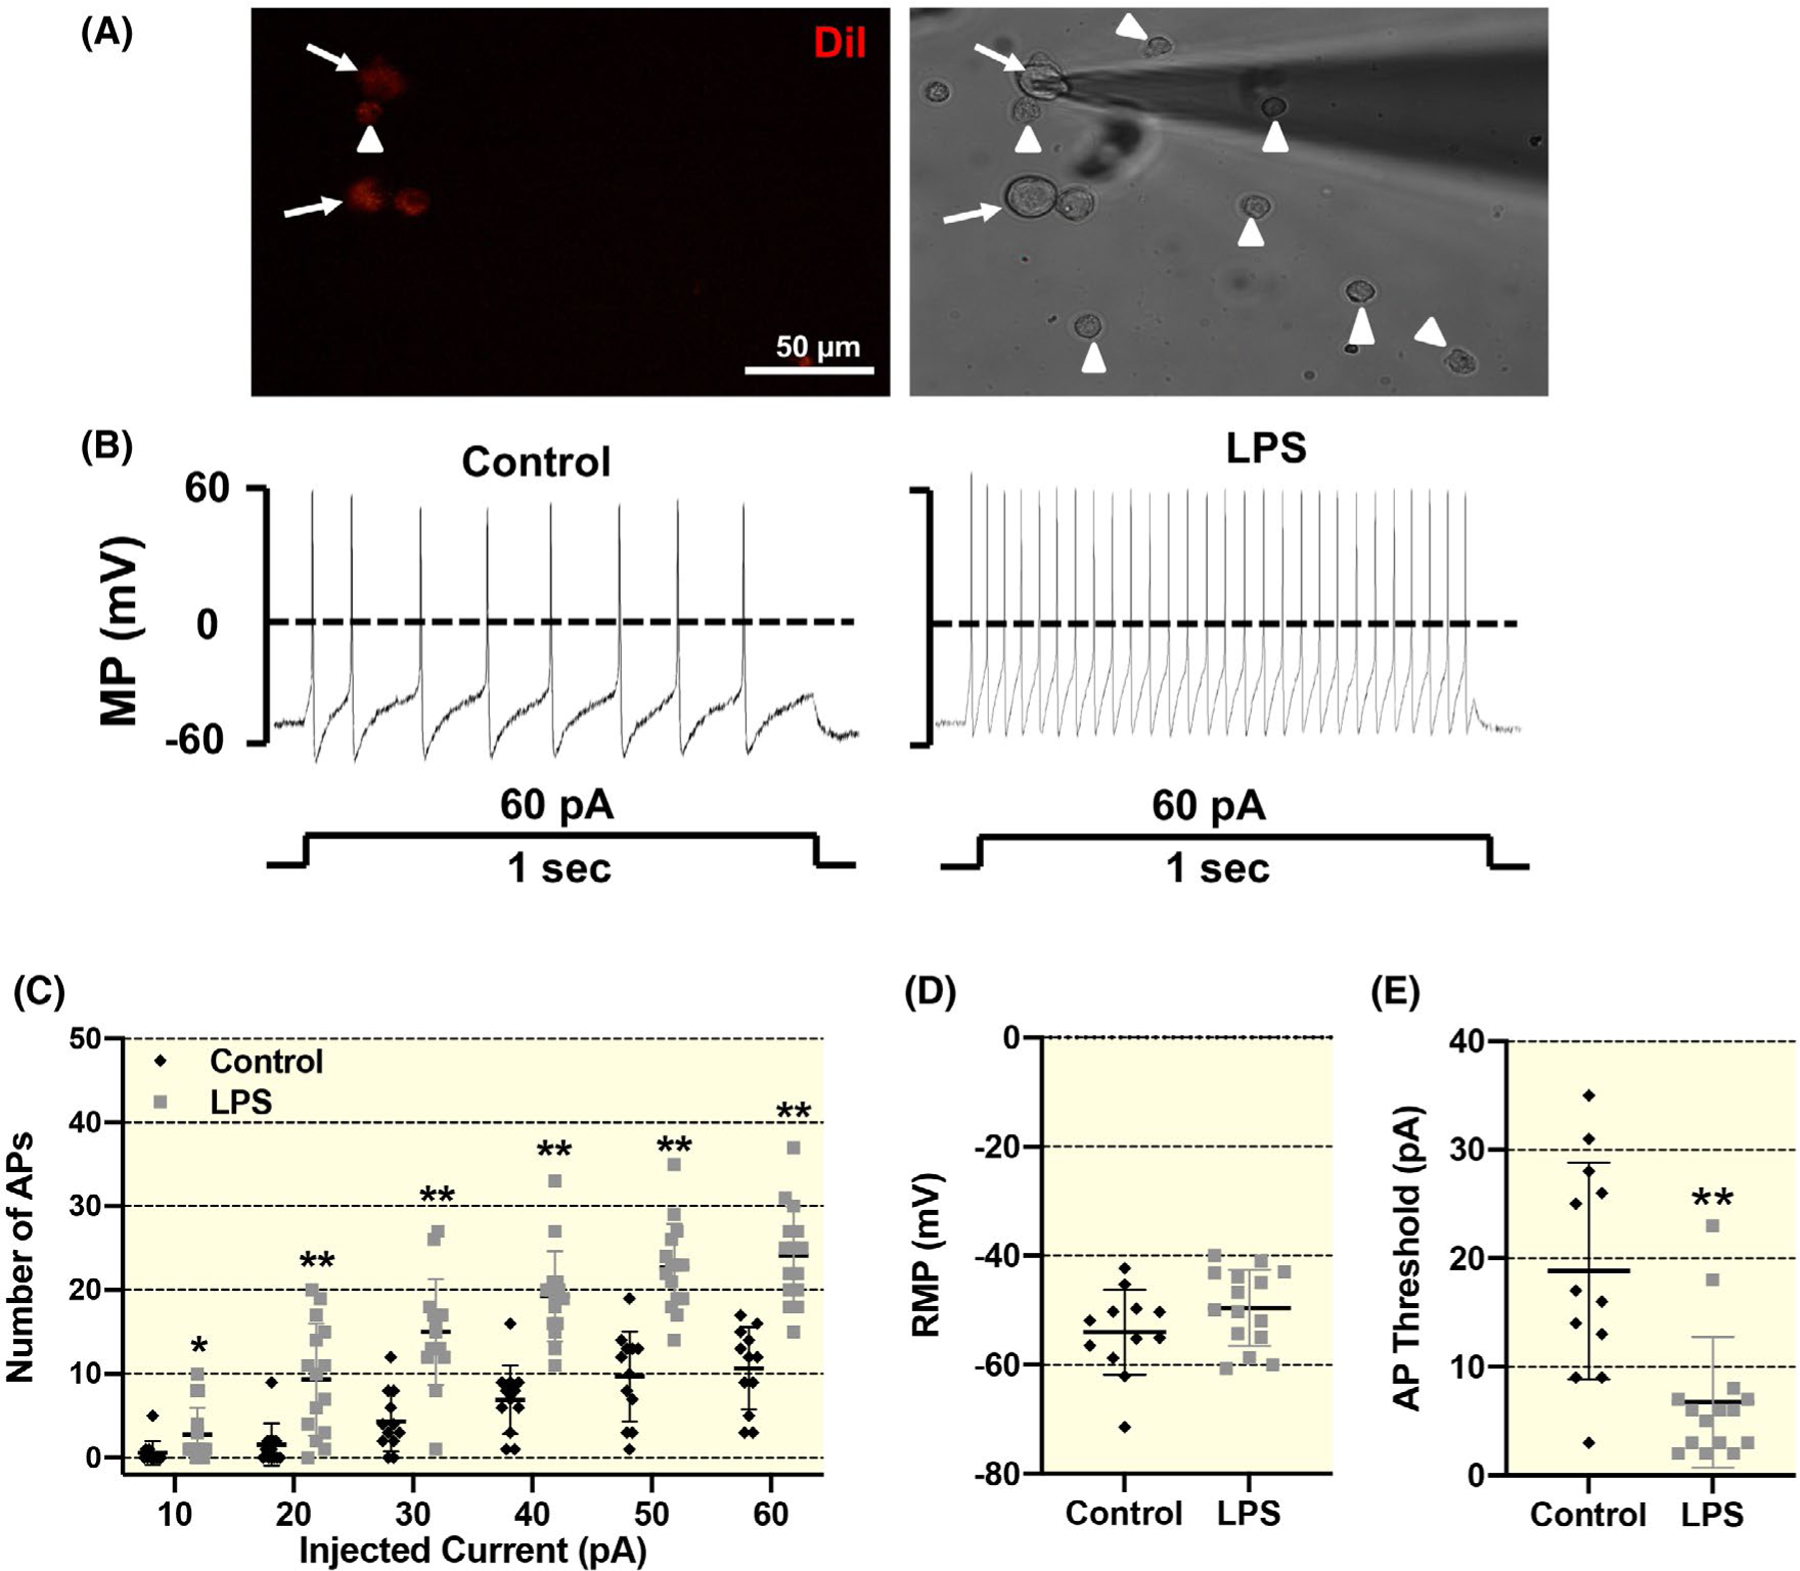
FIGURE 7.

Representative images and summary data showing the influence of macrophages on cardiac SG neurons in vitro. A, Representative images showing co-culture of neuronal tracer DiI-labelled cardiac SG neurons with lipopolysaccharide (LPS)-pretreated RAW264.7 macrophages during patch-clamp experiments. The DiI-labelled SG neurons are depicted by white arrow, and macrophages are shown by white arrowheads. Scale bar = 50 μm. B-E, original patch clamp tracings and mean data showing the action potential (AP) properties in response to both step and ramp current-injection protocols in DiI-labelled cardiac SG neurons following overnight co-culture with vehicle- or LPS-pretreated macrophages. Data are expressed as mean ± SD. n = 12 neurons from 6 rats/vehicle group, n = 15 neurons from eight rats/LPS-pretreated macrophages group. *P <.05 and **P <.01 versus control group. AP, action potential. MP, membrane potential; RMP, resting membrane potential
