
Fig. 3.
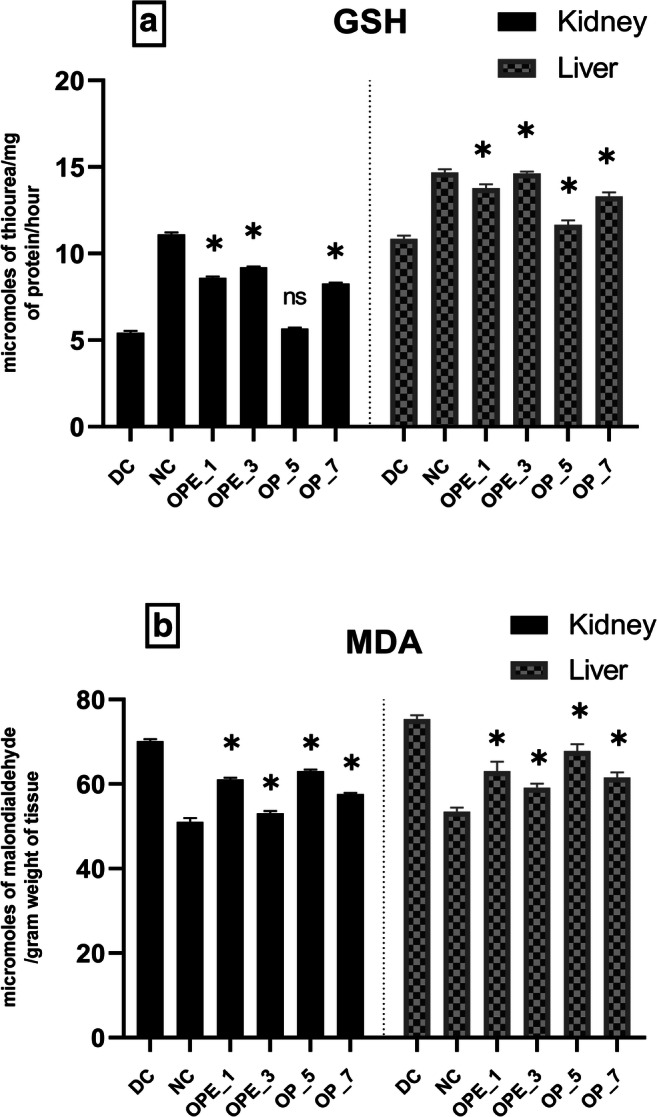
Effects of onion peel extract and onion powder supplemented bread on GSH (a) and MDA (b) levels activities in the liver and kidney tissues of normal and experimental rats. NC = normal control, DC = diabetic control, OPE_1 = group fed with bread containing 1% onion peel extract, OPE_3 = group fed with bread containing 3% onion peel extract, OP_5 = group fed with bread containing 1% onion powder, OP_7 = group fed with bread containing 7% onion powder.*shows the significant difference compared with the diabetic control group (p < 0.01) via Dunnett’s multiple comparison test, while ‘ns’ shows a non-significant difference