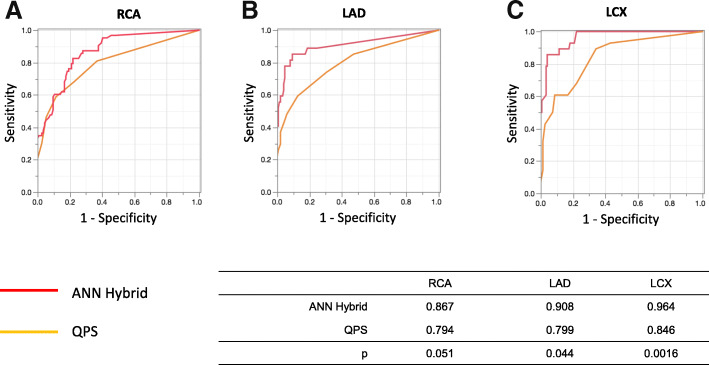
Fig. 5.
Areas under ROC curves derived from analysis of RCA (a), LAD (b), and LCX (c) by ANN and QPS. ANN artificial neural network, LAD left anterior descending coronary artery, LCX left circumflex coronary artery, QPS quantitative perfusion single-photon emission computed tomography, RCA right coronary artery, ROC receiver operating characteristics

