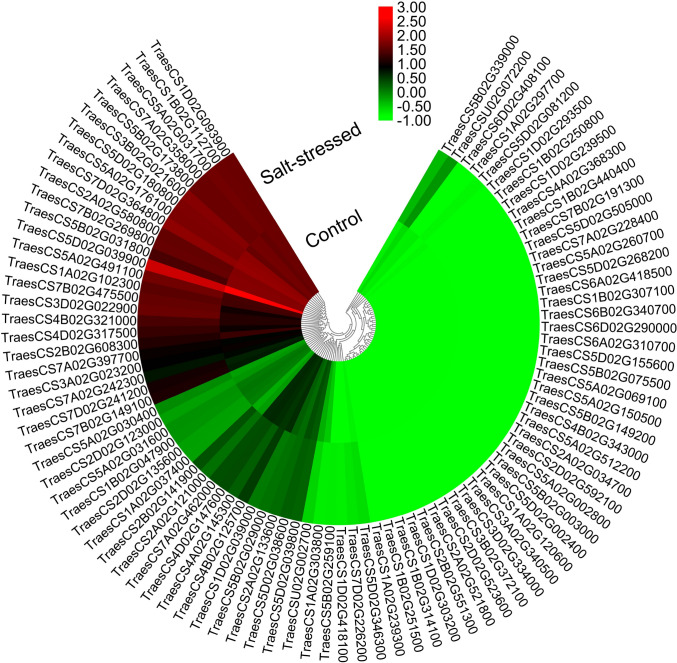
Fig. 5.
Expression profiles of TaSOS1 genes under the optimum (control) and salt-stressed conditions using the RNA-seq data of Amirbakhtiar et al. (2019). The heat map was constructed using MeV software. Hierarchical clustering was carried out for the transcript abundance under both conditions. Changes in gene expression are shown in color as the scale

