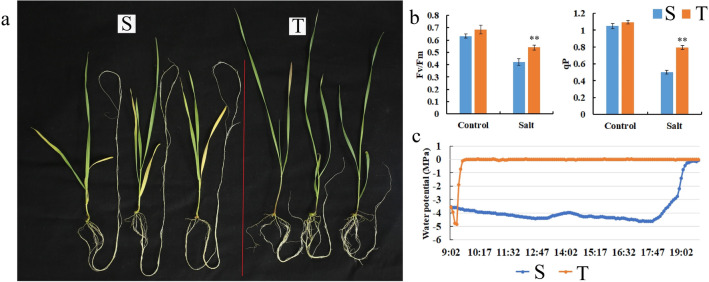
Fig. 8.
Evaluation of salt-sensitive (S) and salt-tolerant (T) wheat seedling for salt stress. a Salt stress phenotypes, b Chlorophyll fluorescence parameters, c Water potential characteristics. Data are means of three independent replicates ± SD. Asterisks indicate significant differences (*P < 0.05 and **P < 0.01)

