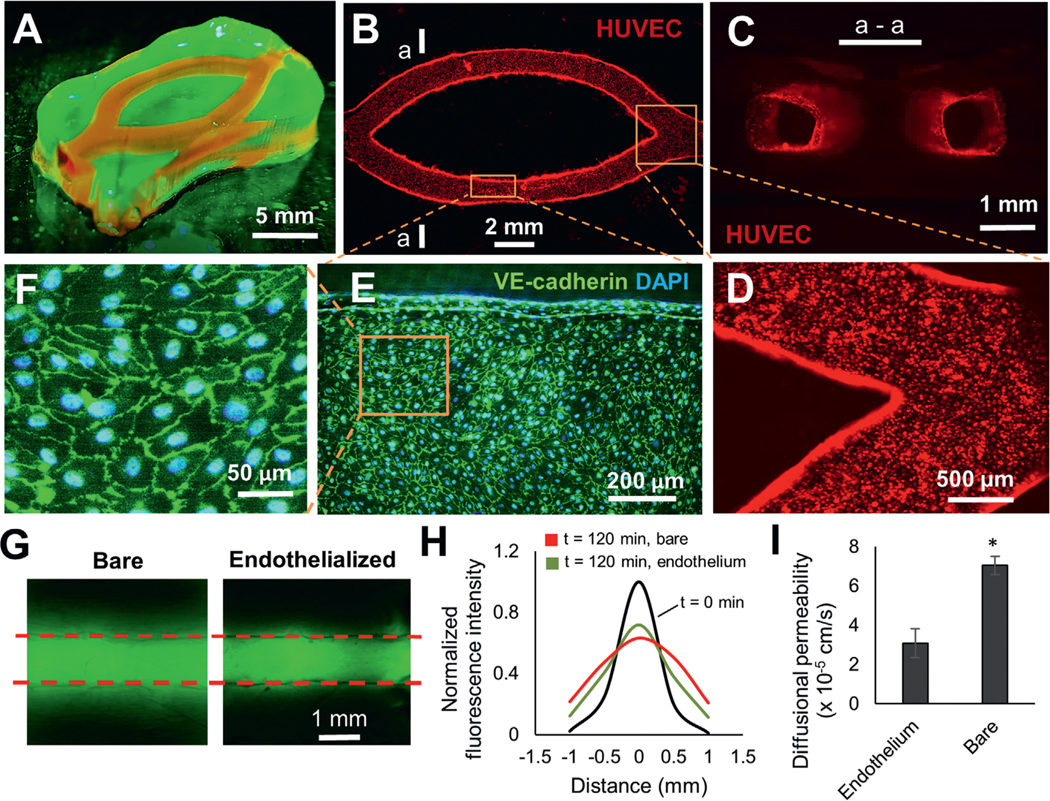
Figure 5.
Endothelialize the printed vessel network in FLOAT-printed model. A) A centimeter-size, channelized hydrogel model is illuminated under fluorescence. Channels are shown by injected rhodamine dye. B) A fluorescence image of HUVEC-lined channels 9 d after endothelial seeding. C) The cross-sectional view of endothelialized channels at section a—a shown in (B). D) Zoom-in view of endothelialized corner region of the channels. E) Immunofluorescent co-staining of the VE-cadherin and DAPI shows the formation of a confluent endothelial monolayer in the channel. F) A zoom-in view of the cell layer shows well-formed endothelial cell junctions. G) Fluorescence images show the diffusion of FITC–dextran (3—5 kDa) in bare and endothelialized channels 120 min after injection. H) The plot of normalized fluorescence intensity change due to dextran dye diffusion in the vicinity of a bare and an endothelialized channel over a 120 min period. I) Calculated diffusional permeability of bare and endothelialized channels. Models in this figure were printed using 7% GelMA + 3% PEGDA 8 kDa. Data are reported as mean ± SD, n = 3, * p < 0.05.

