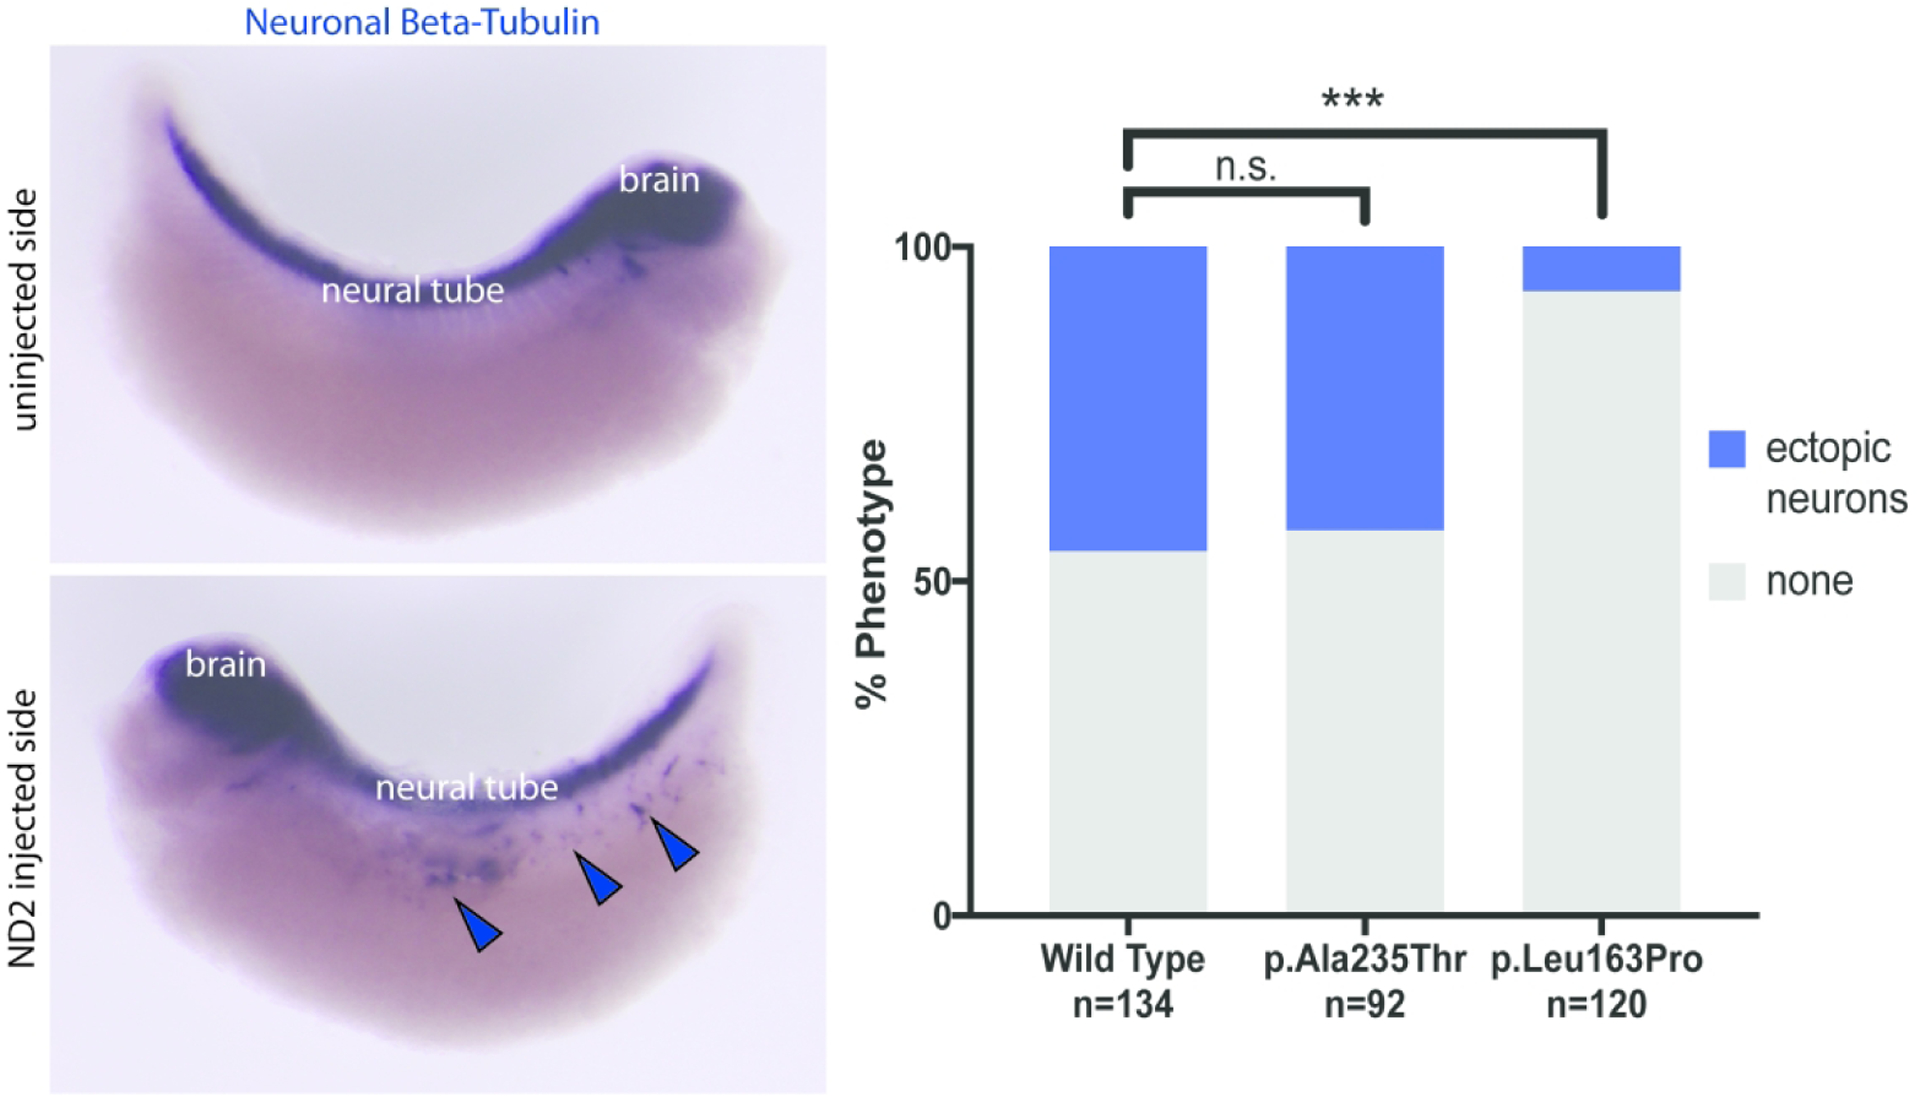
Figure 2:

Induction of ectopic neurons in vivo with NEUROD2 overexpression. Left panel with neuronal beta-tubulin staining showing normal neuronal configuration (top) and ectopic neuronal induction (bottom). Chart in right panel shows quantification of ectopic neuronal induction for wild type NEUROD2 and both patient variants tested. “n” denotes number of individual embryos scored for phenotype for the indicated variant. Bars at top denote significance of difference as compared to wild type (n.s. = not significant, *** = significant).
