
Figure 5. In vivo cardiac T2* measurement from the representative rat.
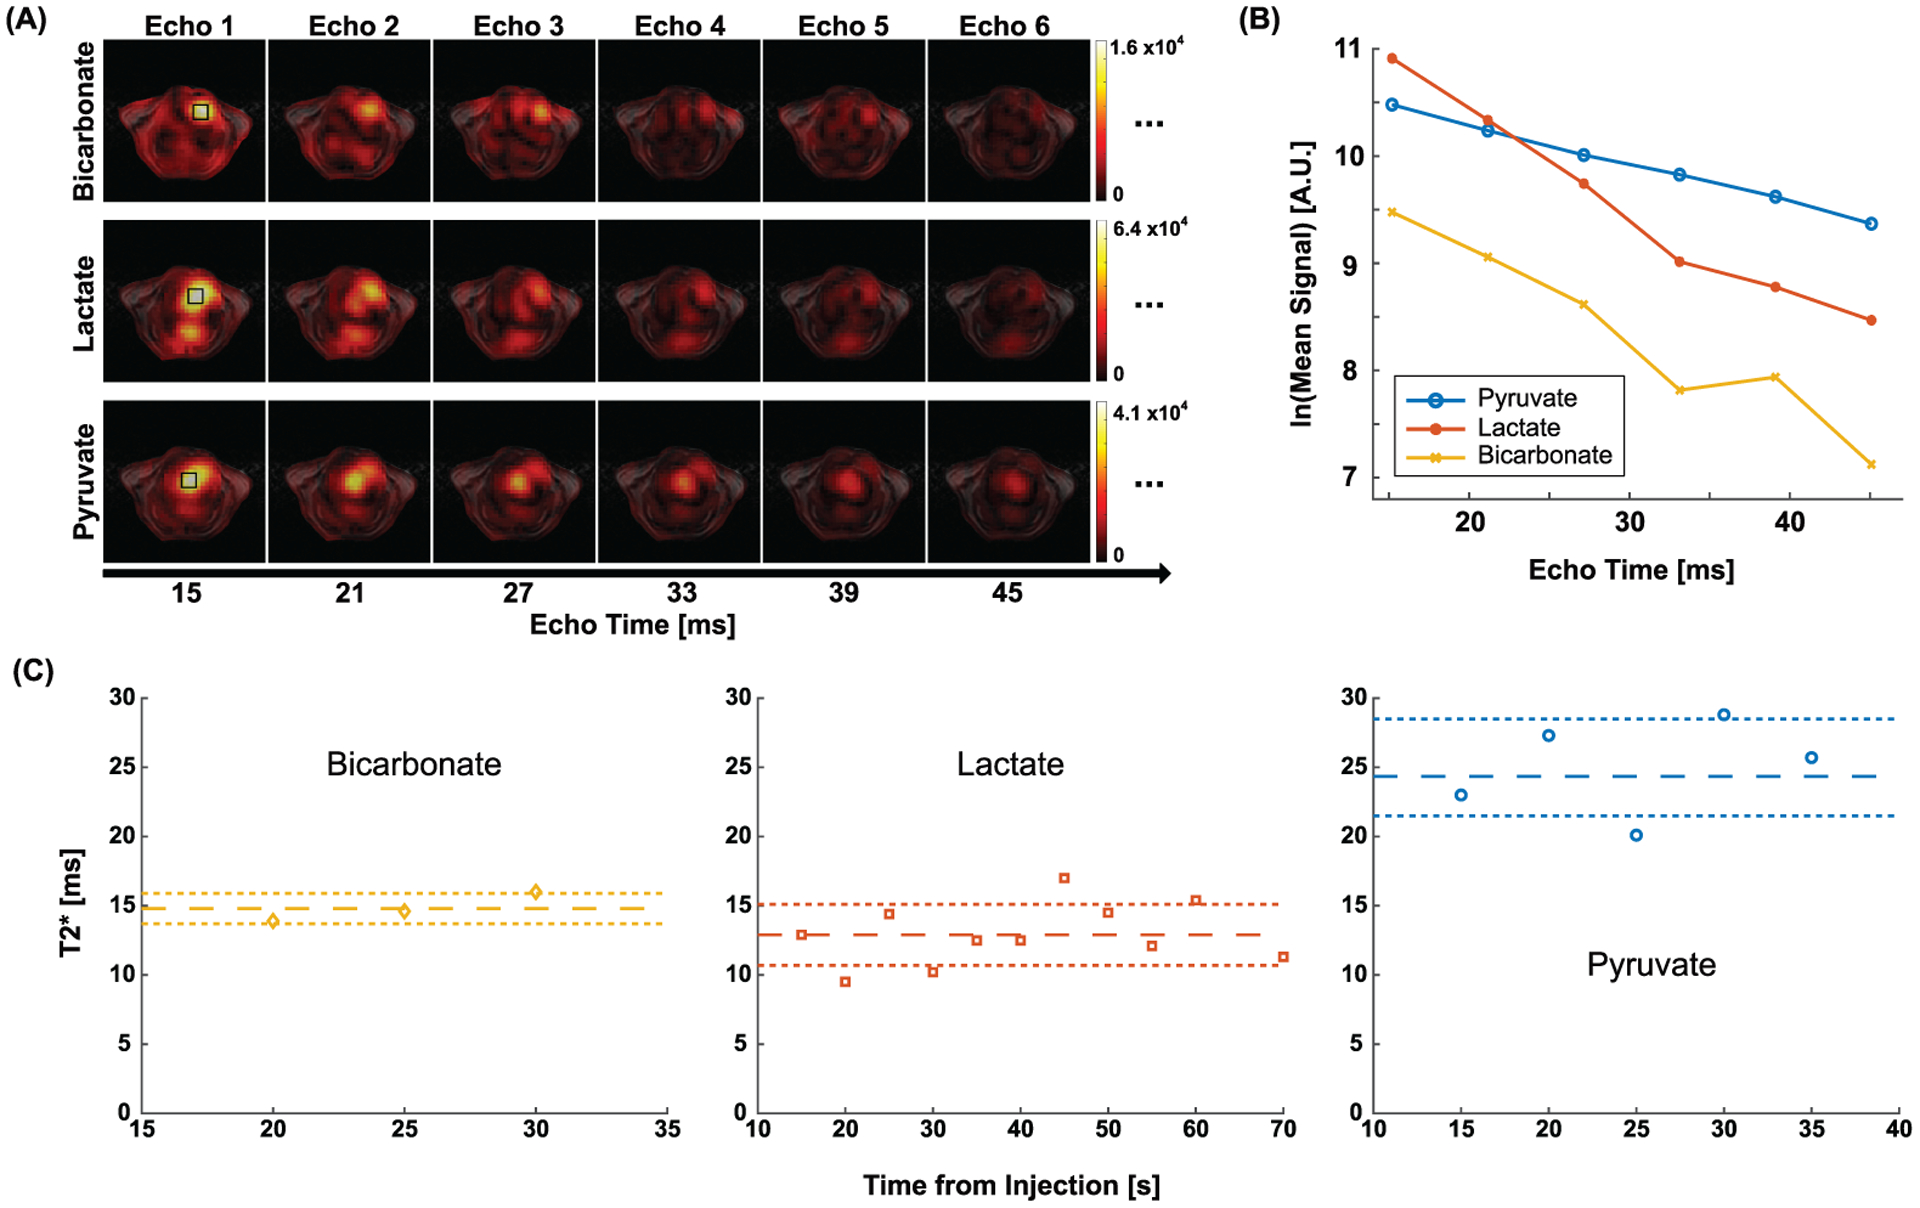
(A) The first six echo images of [1-13C]pyruvate, [1-13C]lactate and [13C]bicarbonate at 20 s. (B) Signal decay of HP 13C metabolites in the ROI (black squares in (C)) along echo time. (C) T2*s of HP signals at different timepoints. The reference lines denote mean ± standard deviation.