
Figure 6. Reproducibility of T2* measurements in rats.
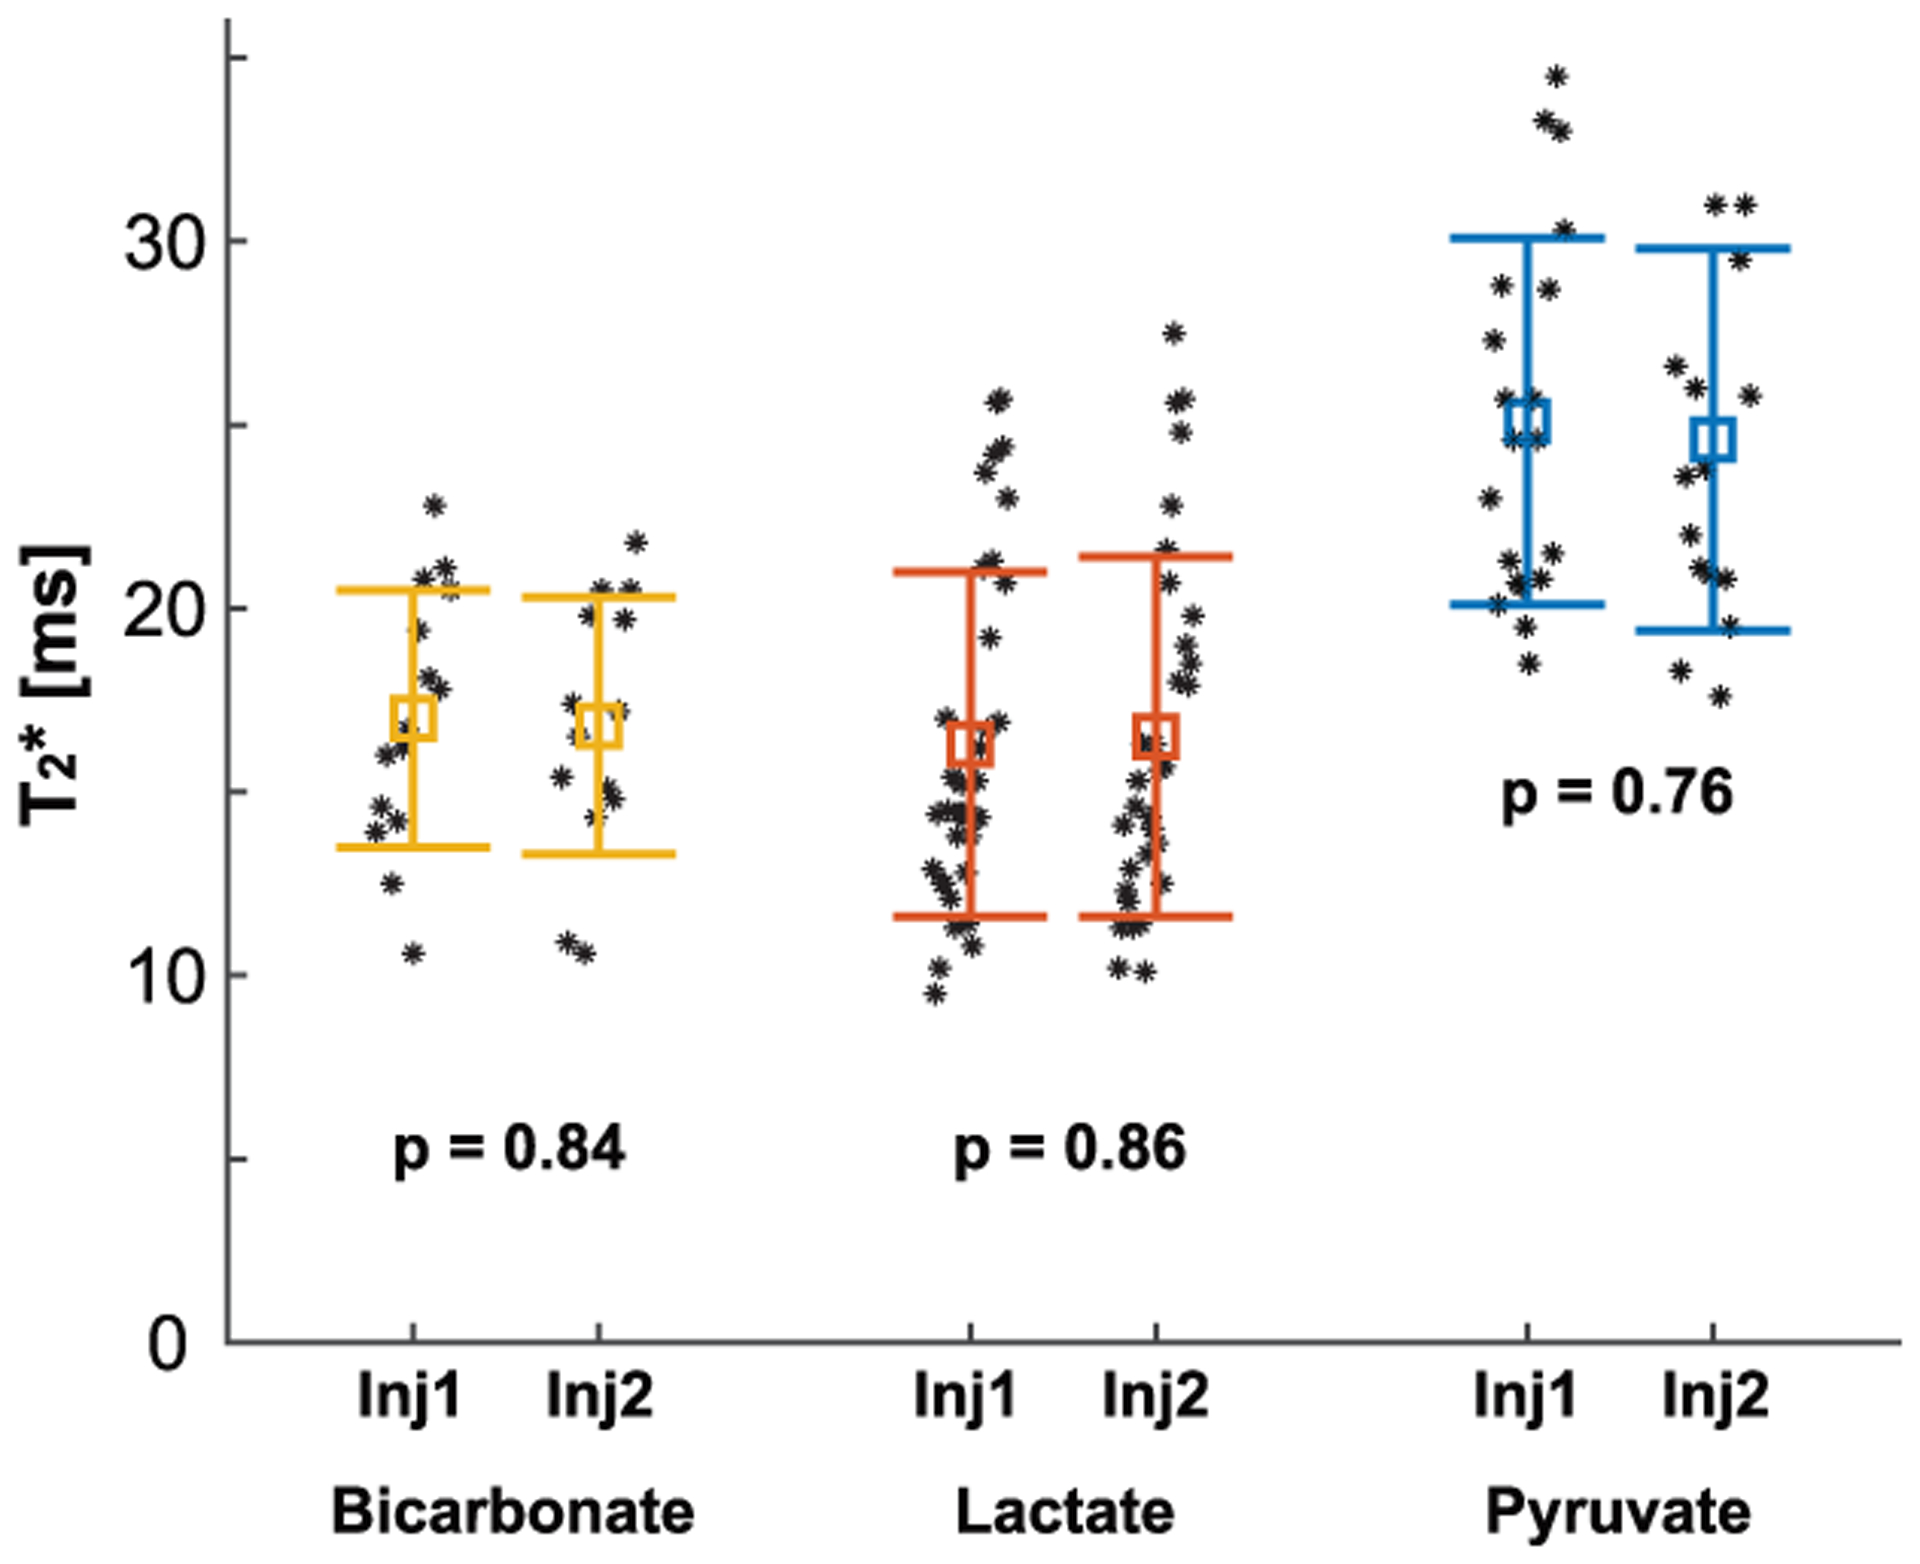
T2*s of the HP 13C-metabolites measured from two consecutive HP [1-13C]pyruvate injections were consistent (p > 0.05). Each marker represents a T2* measurement from a single timepoint and the error bars denote the mean ± standard deviation.