
Fig. 6. ERα controls Ucp1 induction, mitochondrial morphology, and thermogenic capacity of BAT.
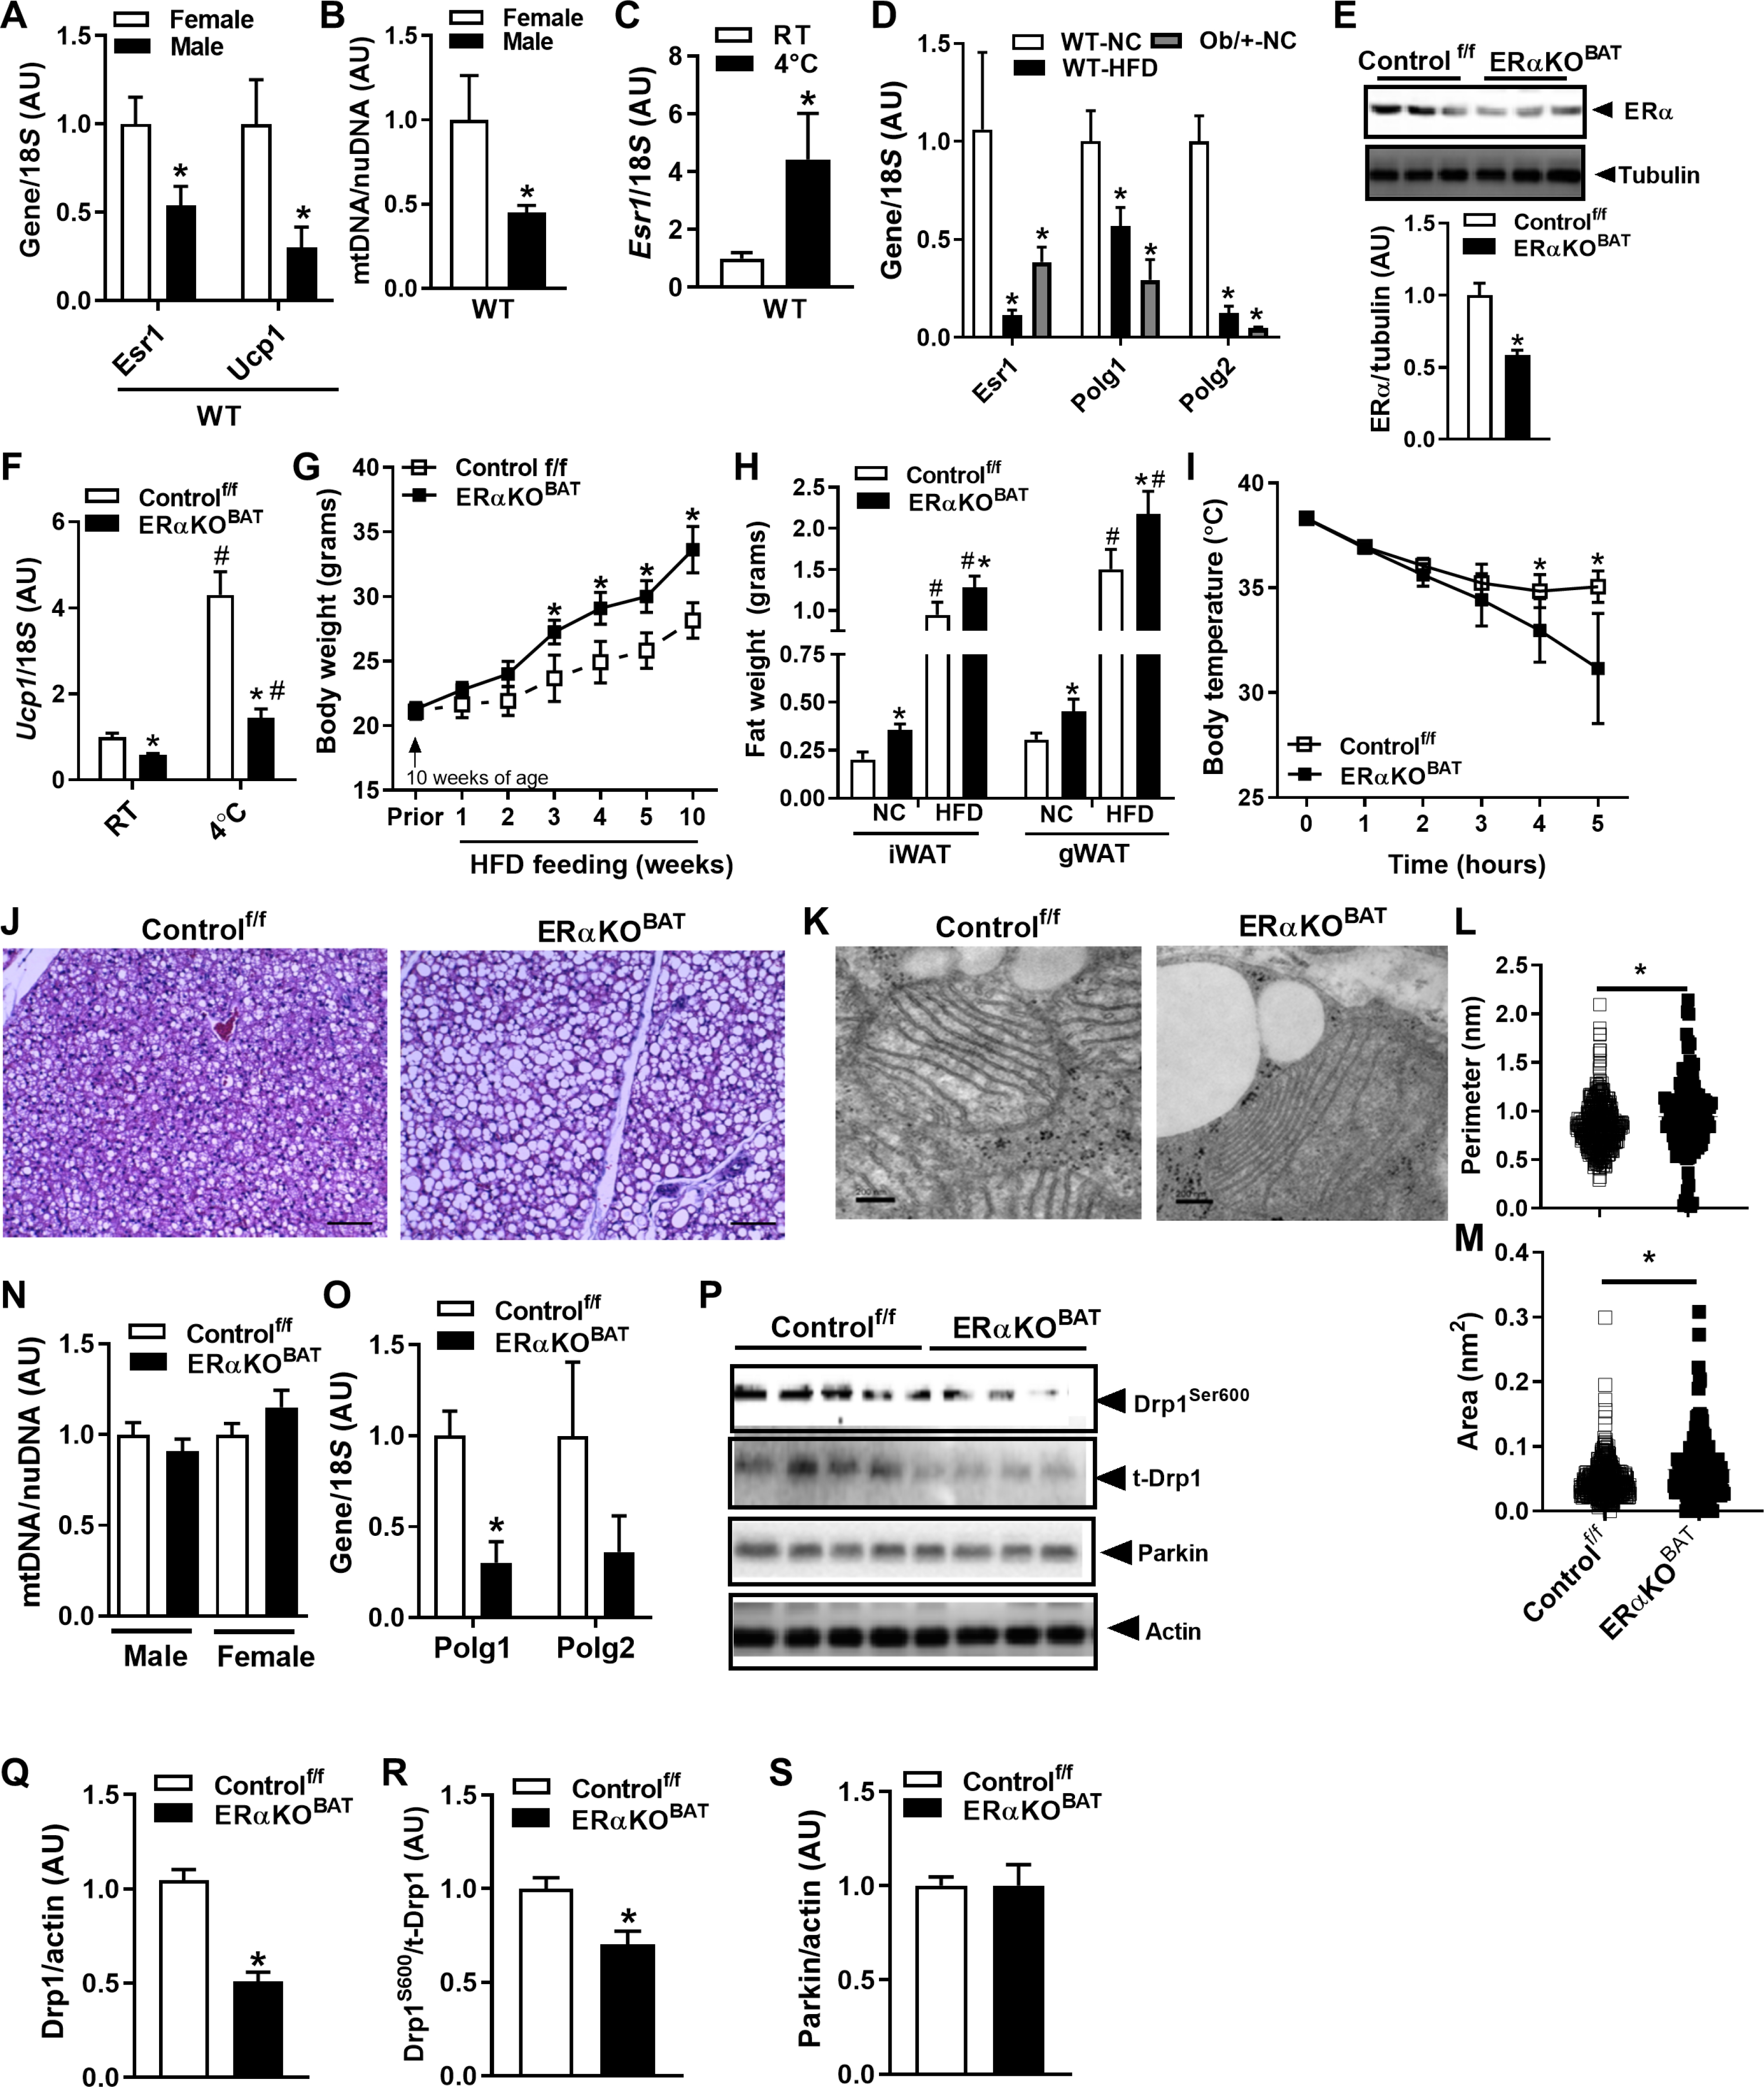
(A) Sex difference in Esr1 and Ucp1 expression and (B) mtDNA copy number in BAT of male and female WT mice (n = 5 to 6 mice per sex). (C) Esr1 expression is induced in BAT of WT female mice during cold challenge (5 hours, 4°C) versus room temperature (RT). (D) Expression of Esr1, Polg1, and Polg2 in HFD-fed or with genetic obesity (LepOb/+) with NC-fed WT mice (n = 5 to 6 mice per group). (E) Confirmation of ERα deletion in BAT from female ERαKOBAT mice (n = 6 per genotype). (F) Ucp1 expression in BAT at room temperature ERαKOBAT and impaired Ucp1 induction during cold challenge (5 hours, 4°C) in female ERαKOBAT mice versus Controlf/f. (G) Body weight during early HFD feeding of female versus Controlf/f (n = 5 to 6 per genotype). (H) WAT, inguinal (iWAT) and gonadal (gWAT), in female ERαKOBAT versus Controlf/f under normal chow (NC) and high-fat diet (HFD) feeding (n = 5 to 6 mice per genotype). (I) Body temperature in ERαKOBAT versus Controlf/f over time during cold challenge (5 hours, 4°C). (J) Increased lipid droplets in BAT from ERαKOBAT versus Controlf/f detected by histochemistry (n = 3 per genotype). (K) Transmission electron microscopy showing mitochondrial architecture in ERαKOBAT versus Controlf/f, with mitochondrial images quantified for (L) perimeter and (M) area. (N) mtDNA copy number determined by quantitative PCR (qPCR) in BAT from male and female ERαKOBAT versus Controlf/f (n = 5 to 6 mice per genotype; normalized to 1.0). (O) Polg1 expression in BAT of female ERαKOBAT versus Controlf/f. (P to S) Immunoblots and corresponding densitometry showing (Q) parkin protein expression, (R) Drp1 total protein, and (S) Drp1Ser600 phosphorylation in ERαKOBAT versus Controlf/f (n = 5 to 6 mice per genotype). Data are means ± SEM. Student’s t test or one-way ANOVA, *P < 0.05 between the genotypes or sexes. #P < 0.05 within group and between conditions.