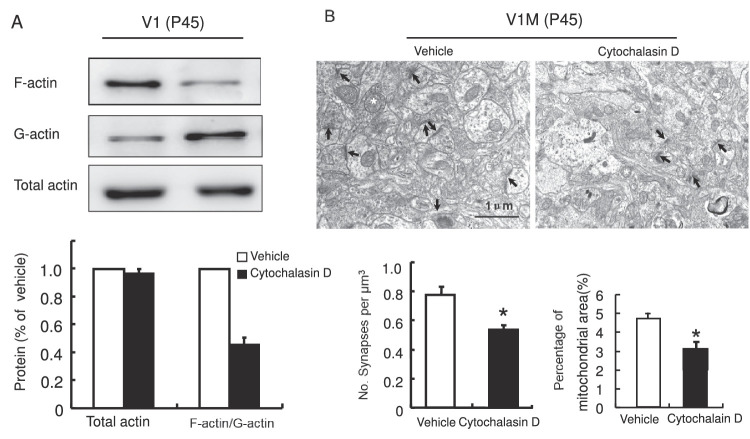
Figure 4.
Actin dynamics regulate structural and functional synaptic plasticity in the visual cortex. (A) Western blot analysis of synaptosomal total actin and F-actin/G-actin in the V1 of vehicle-treated or cytochalasin D–treated animals. Statistical values are shown as the mean ± SEM. At least three samples from each group were assessed. Each sample consisted of the visual cortices of seven rats. (B) Representative visual fields illustrate synaptic density and mitochondrial area in the V1M of the vehicle-treated and cytochalasin D–treated groups. Black arrows indicate synapses, and a white asterisk in each photograph indicates a mitochondrion. Statistical values are shown as the mean ± SEM. Each group consisted of three to four rats (*P < 0.05, **P < 0.01 vs. vehicle group).

