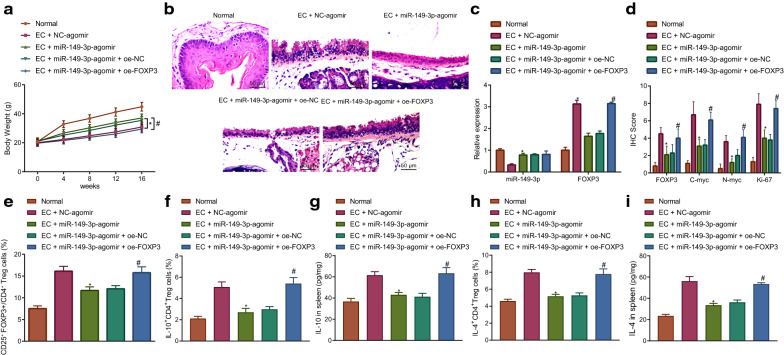
Fig. 3.
miR-149-3p inhibits regulatory T cell differentiation to repress immune escape in EC mice via FOXP3. Normal mice were used as controls, and EC mice were treated or not treated with NC-agomir, miR-149-3p-agomir, miR-149-3p-agomir + oe-NC or miR-149-3p-agomir + oe-FOXP3. A The weight of mice. B Pathological changes of tissues in mice measured by HE staining (200×). C FOXP3 expression in tissues of mice detected by RT-qPCR normalized to GAPDH. D Immunohistochemistry result of detecting FOXP3, C-myc, N-myc and Ki-67 protein expression. E The percentage of CD25+FOXP3+ T cells in CD4+ T cells in mice spleen assessed by flow cytometry. F The percentage of IL-10+CD4+ T cells in mice spleen assessed by flow cytometry. G IL-10 level in the spleen of mice assessed by ELISA. H The percentage of IL-4+CD4+ T cells in mice spleen assessed by flow cytometry. I IL-4 level in the spleen of mice assessed by ELISA. * p < 0.05 vs. EC mice treated with NC-agomir. # p < 0.05 vs. EC mice treated with miR-149-3p-agomir + oe-NC. Measurement data were expressed as mean ± standard deviation. Data between two groups were compared by independent sample t test. Comparisons among multiple groups were performed using one way analysis of variance (ANOVA), followed by Tukey's post hoc test, and data at different time points among multiple groups were compared by repeated measures ANOVA, followed by Bonferroni post hoc test. n = 10

