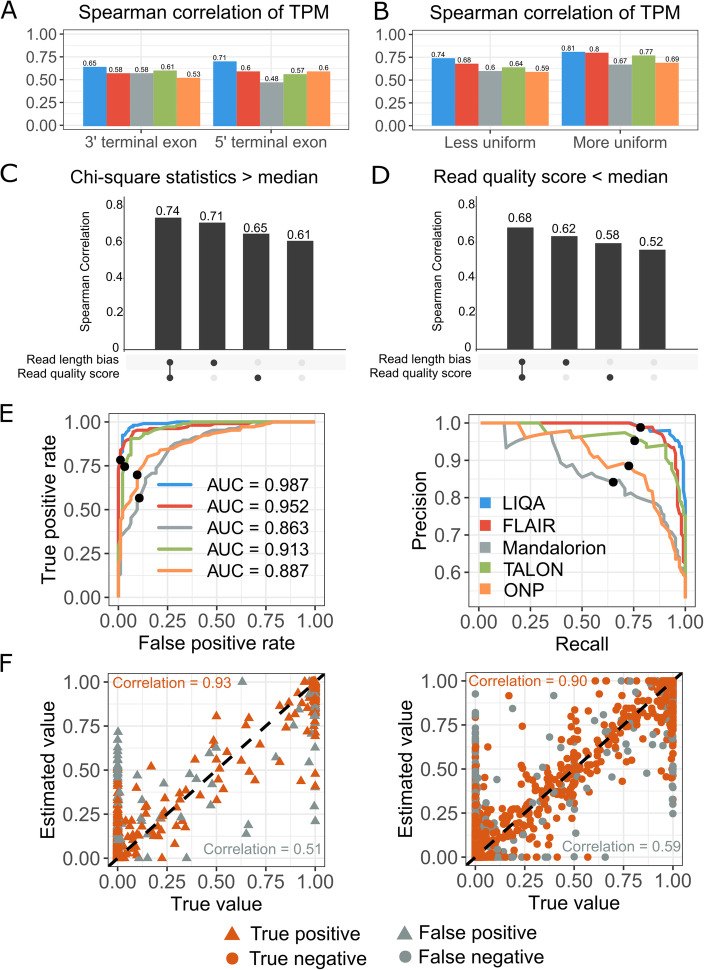
Fig. 3.
Evaluation of robustness to read length bias and low read quality (A–D) and comparison of DAS events detection (E, F) using LIQA (blue), FLAIR (red), Mandalorion (gray), TALON (green), and ONP (yellow). A Spearman’s correlations between estimated and true TPM for 3′ and 5′ terminal exons. B Spearman’s correlations between estimated and true TPM. Isoforms are stratified by the chi-squared goodness of fit statistic for uniformity. The left panel is for those isoforms in which the read coverage distribution is less uniform, and the right panel is for the remaining isoforms. C,D Spearman’s correlation comparison between different models (full model, read length model, read quality model, and baseline model) based on isoforms with chi-squared statistic more than the median (C) and isoforms with average read quality score less than the median (D). E ROC curve and precision recall curve of different methods for DAS gene detection. Threshold FDR < 0.05 is highlighted using black dot. F Scatter plot of true and estimated isoform relative abundance from the first DAS simulation dataset. LIQA’s prediction and ground truth are marked for each isoform

