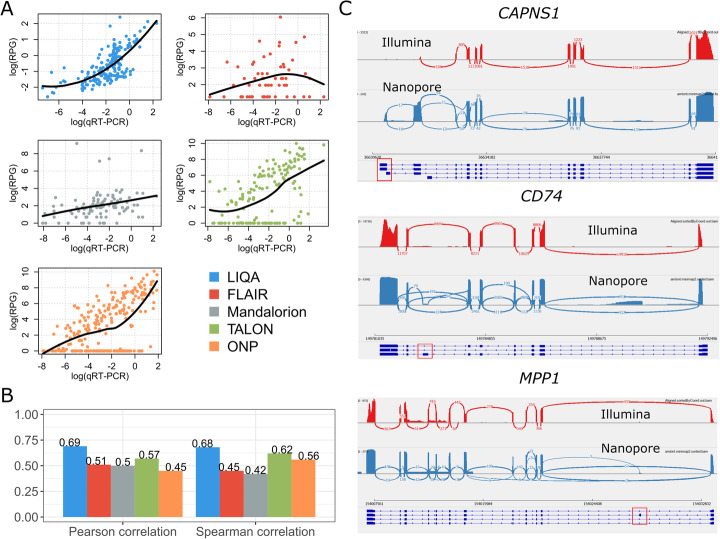
Fig. 4.
Results on UHR data generated by direct mRNA sequencing on the Nanopore platform. A Scatter plots of estimated isoform-specific expression versus qRT-PCR measurements in log scale. Black line represents the local polynomial regression line fitted with estimates and qRT-PCR in log scale. B Pearson’s correlation coefficient (left) and Spearman’s correlation coefficient (right) between estimated isoform-specific expression versus qRT-PCR measurements in log scale. C Examination of read coverage difference between Illumina and Nanopore data at 3 genes. Informative exonic regions were in red square

