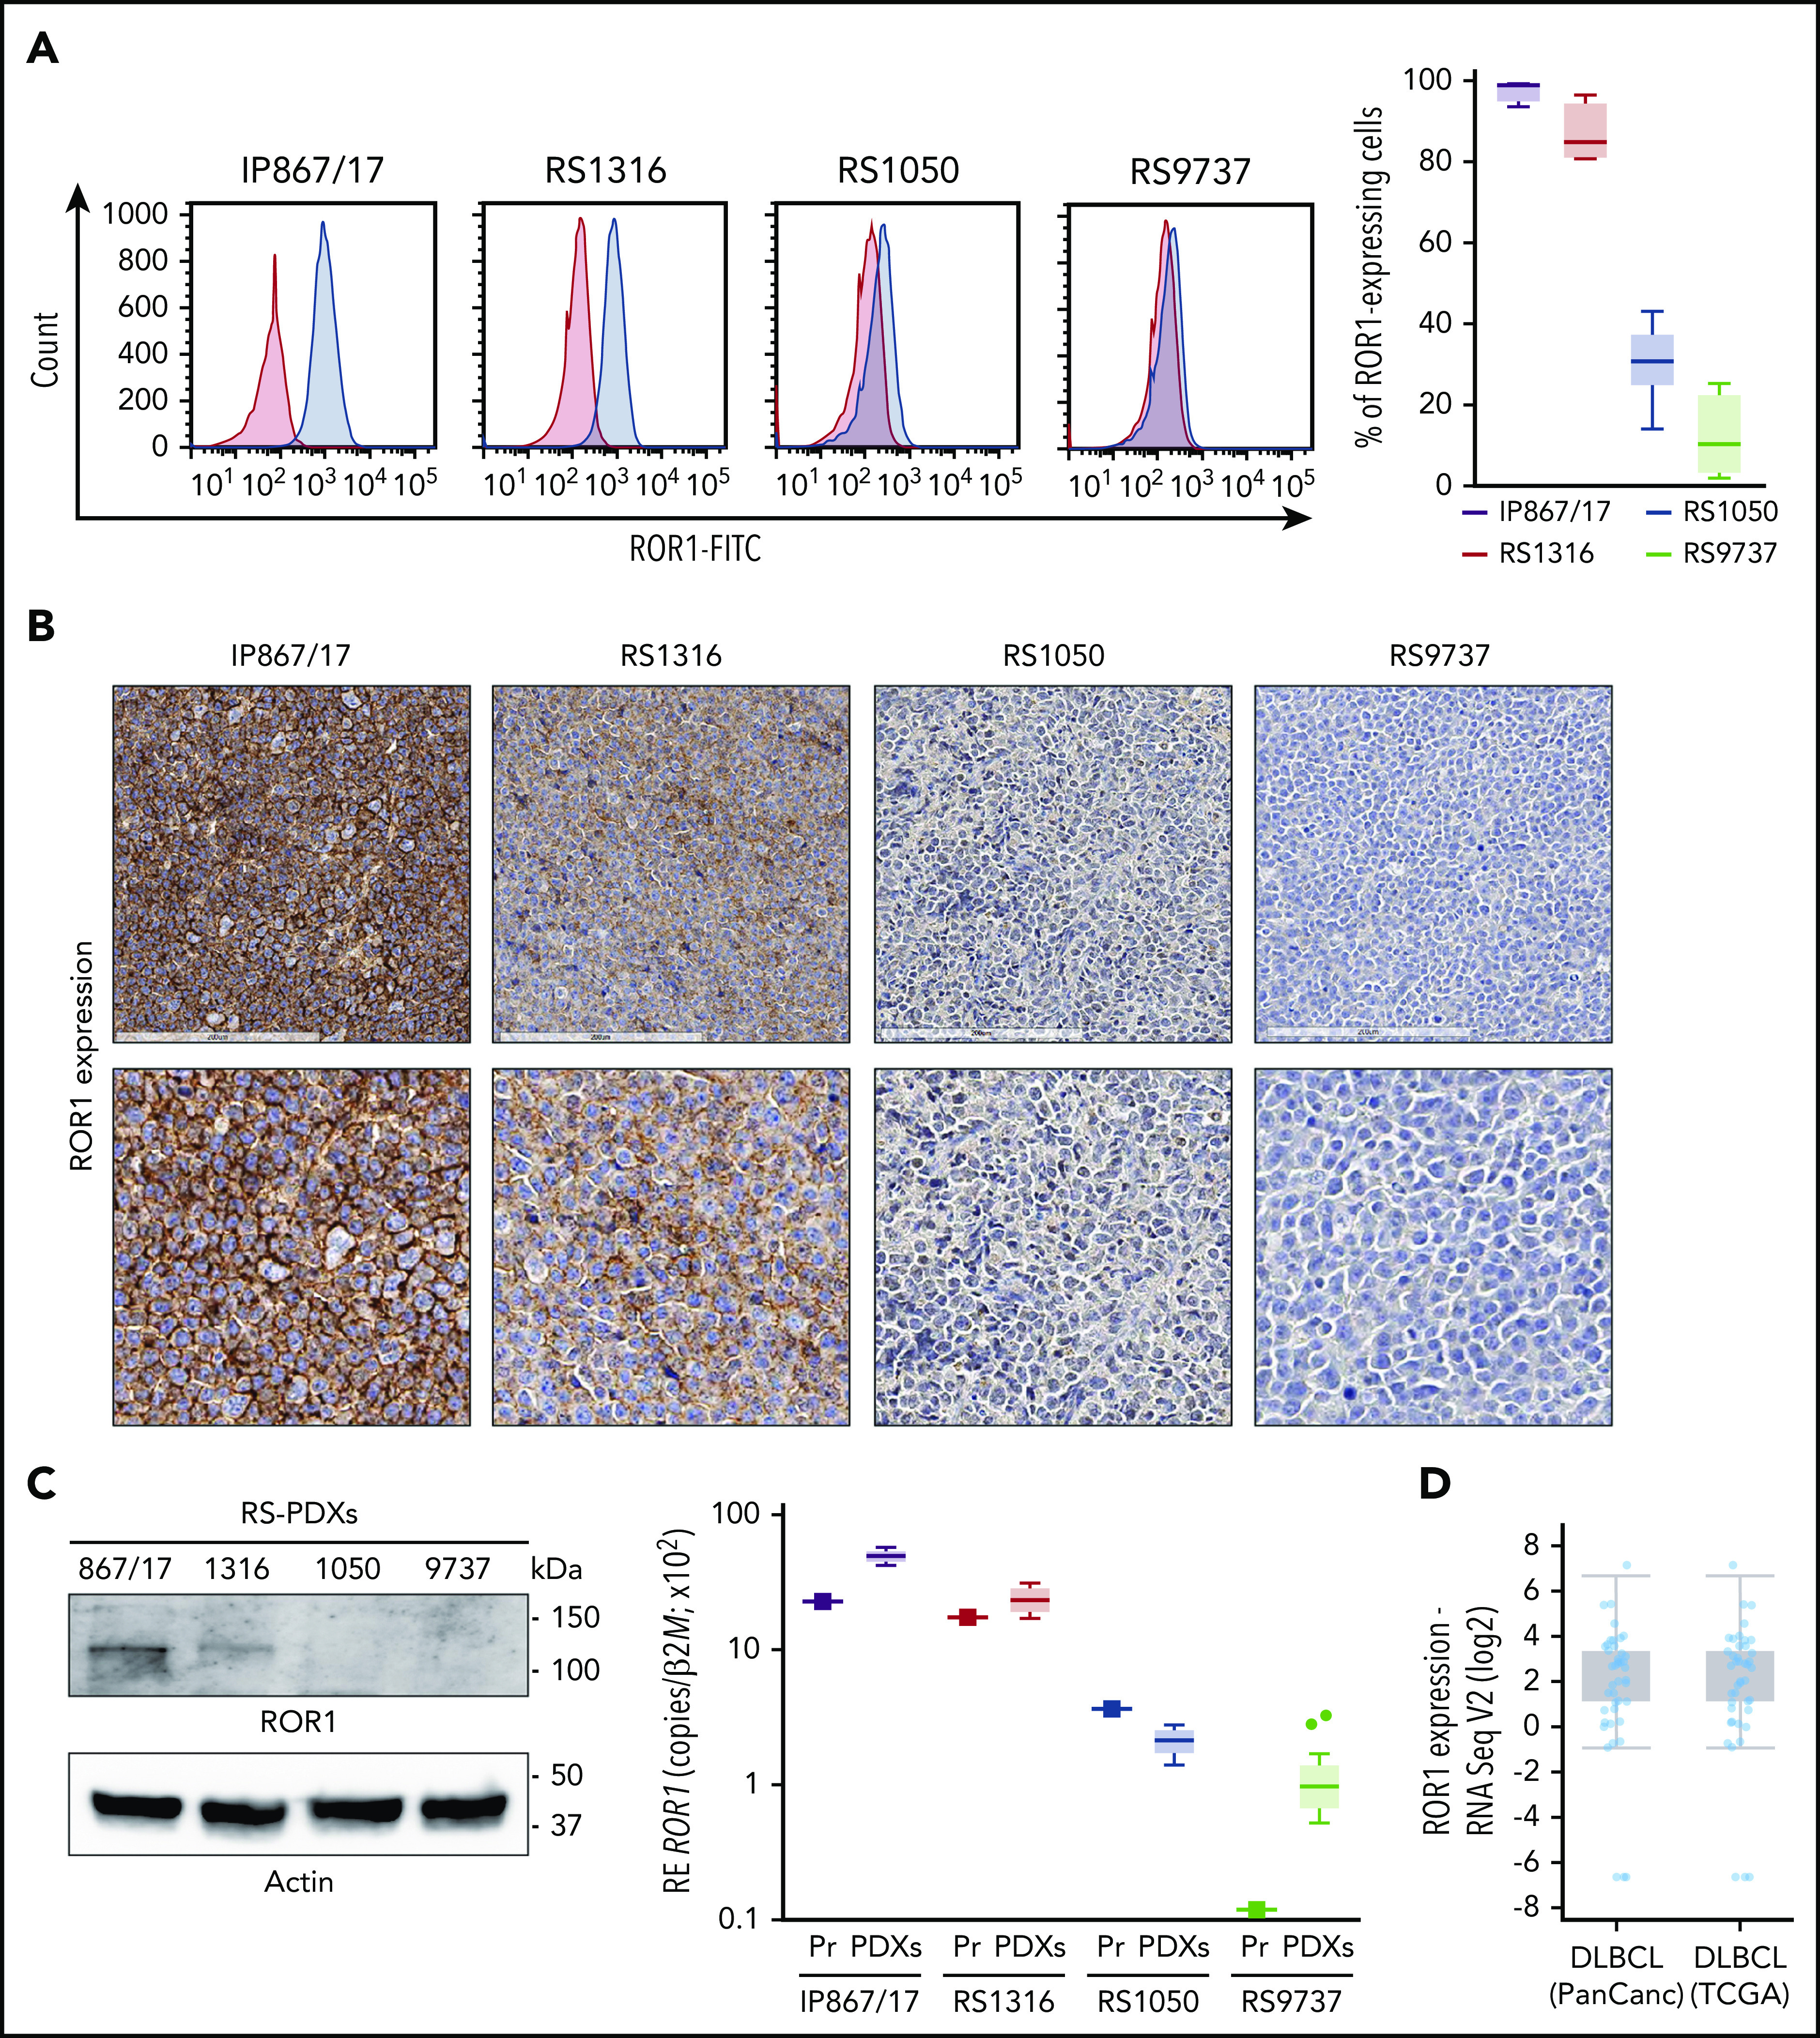
Figure 2.

Expression of ROR1 in RS-PDX models and in DLBCL in TCGA data sets. (A) Representative histogram plots and a cumulative ROR1+ cells (%, n = 4) box plot, obtained by measuring ROR1 expression in RS cells after in vivo growth. Box plots show the distribution of values: median, interquartile range, minimum and maximum values. ROR1 expression was analyzed by flow cytometry using a specific anti-human ROR1 antibody in the 4 RS-PDX models available. RS-PDXs are represented with the indicated color coding. (B) IHC analysis of ROR1 expression in tissue sections of tumor masses obtained from the RS-PDXs using an anti-ROR1 antibody (mouse clone OTI3D11). Slides were developed with DAB (3,3'‑diaminobenzidine) and counter-stained with hematoxylin and eosin. Slides were scanned using an Aperio AT Turbo system to produce whole slide images. A .jpeg image of each stain is shown. Original magnification ×20 (top panel) and ×40 (bottom panel). (C) Western blots and qRT-PCR data showing the expression of ROR1. Actin was used as a loading control in western blot. qRT-PCR data (from primary RS samples and at least 4 different tumor masses) are reported as relative expression (RE) of the target gene over β2-microglobulin (B2M). Box plots show the distribution of values: median, interquartile range, minimum and maximum values (Tukey representation). Squares represent the primary samples. (D) Expression of ROR1 obtained from RNA-sequencing (RNA Seq) data in large data sets of DLBCL samples. Data are reported in The Cancer Genome Atlas (TCGA). Box plots show the distribution of values: median, interquartile range, minimum and maximum values. FITC, fluorescein isothiocyanate; PanCanc, pan cancer; Pr, primary samples.
