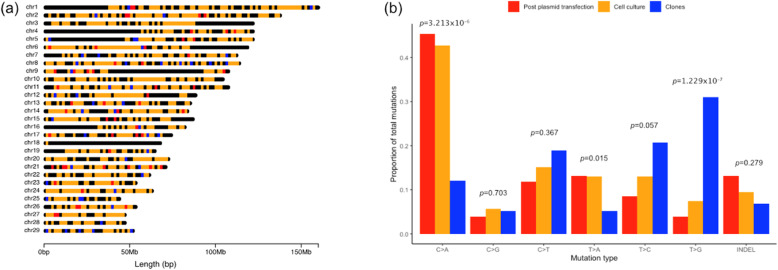
Fig. 4.
Distribution and spectra of de novo mutations predicted to have arisen in cells post plasmid transfection (red), during the cell culture expansion phase (orange) and during development of the cloned calves (blue). (a) Distribution of de novo mutations (SNVs and indels) across the bovine genome. (b) Proportion of de novo mutations within each mutation class observed between groups. A fisher’s exact test comparing the proportion of observed mutations per mutation class between groups, showed a significant difference in C>A mutations (p=3.213x10⁻⁶) and T>G mutations (p=1.229x10⁻⁷).

