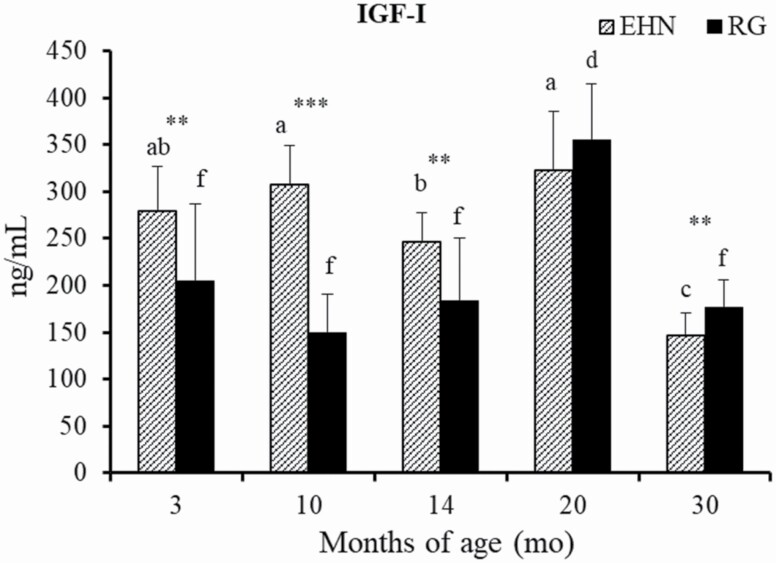
Figure 3.
Comparison of serum IGF-I level during growth between EHN and RG groups. EHN: metabolic imprinting group, n = 12. RG: roughage group, n = 11. Values are means ± SD. ** P < 0.01. *** P < 0.005. a,b,cSignificant differences among months of age in EHN group (P < 0.05). e,fSignificant differences among months of age in RG group (P < 0.05).

