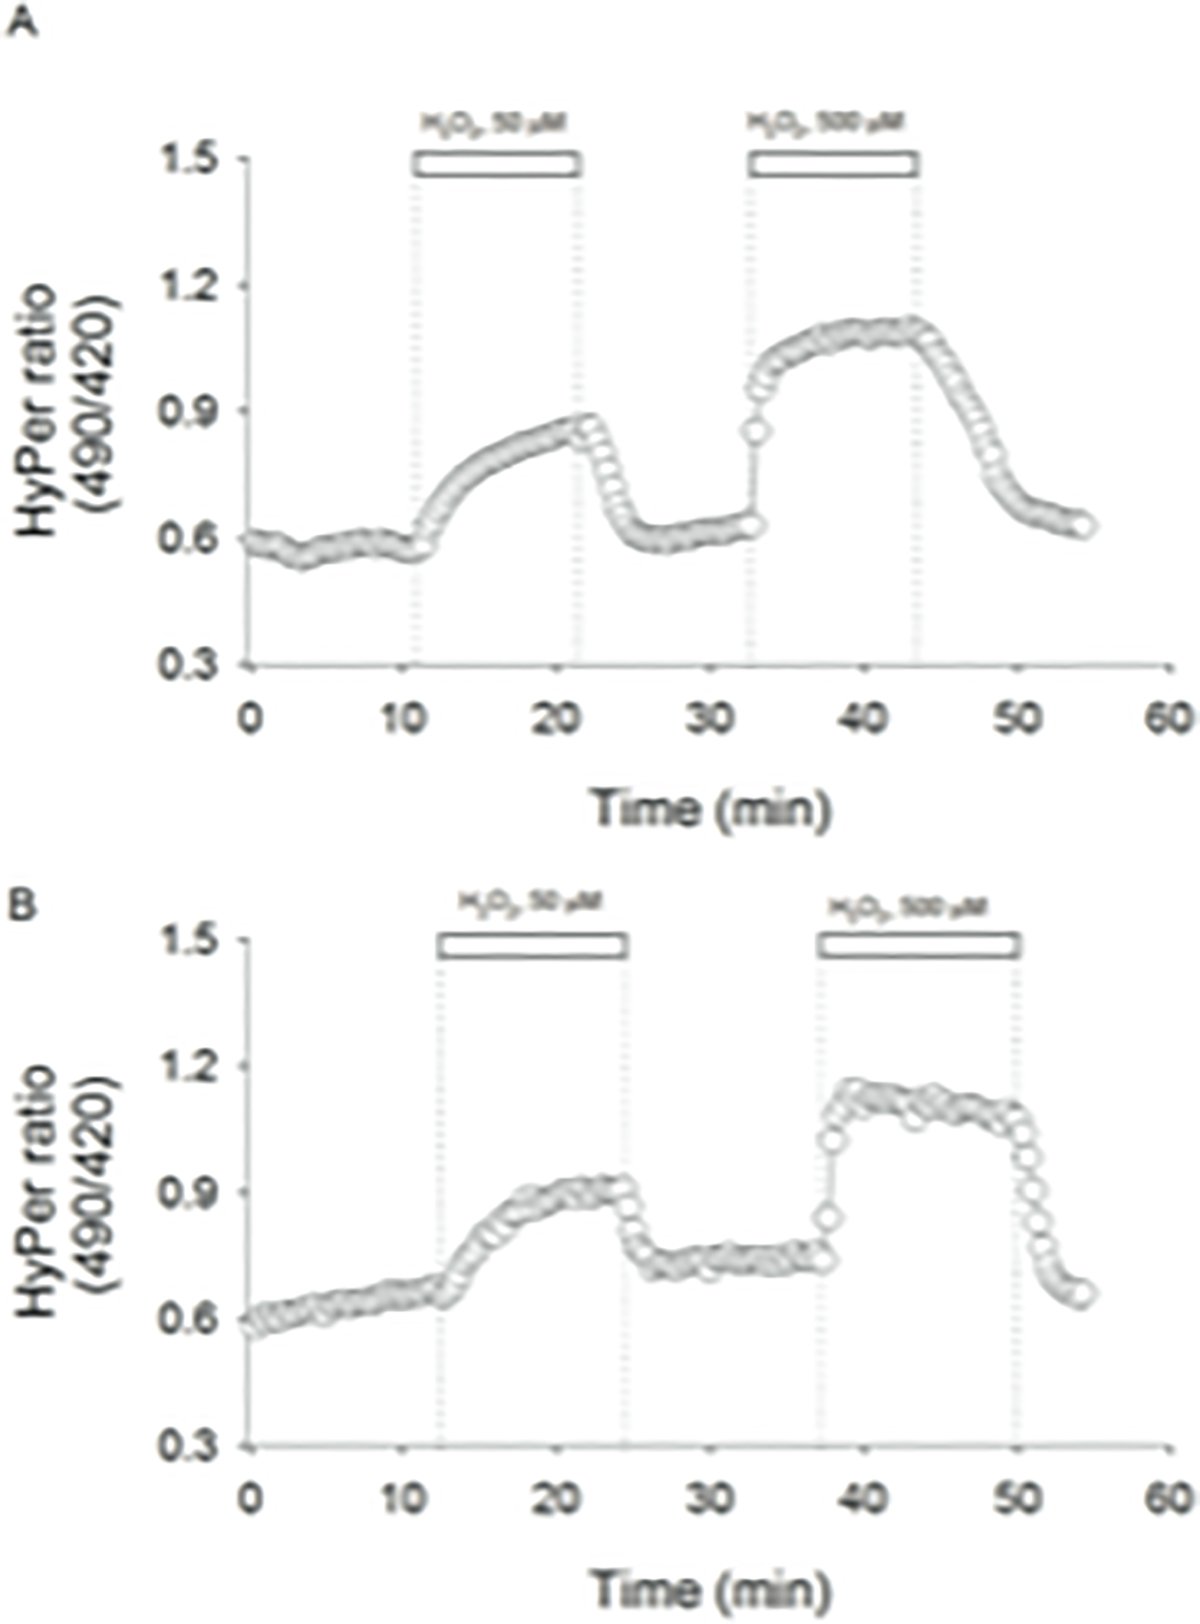
Figure 2.

Representative temporal courses of HyPer signal recorded from control A) and osteoporotic mesenchymal stem cells B). Pulses of 50 μM and 500 μM H2O2 were applied, as indicated by white bars. Cells were excited at 420 nm and 490 nm, and emitted light was collected at 520 nm. Biosensor signals from both excitation wavelengths were acquired each 20 seconds and converted in a ratio (490/420).
