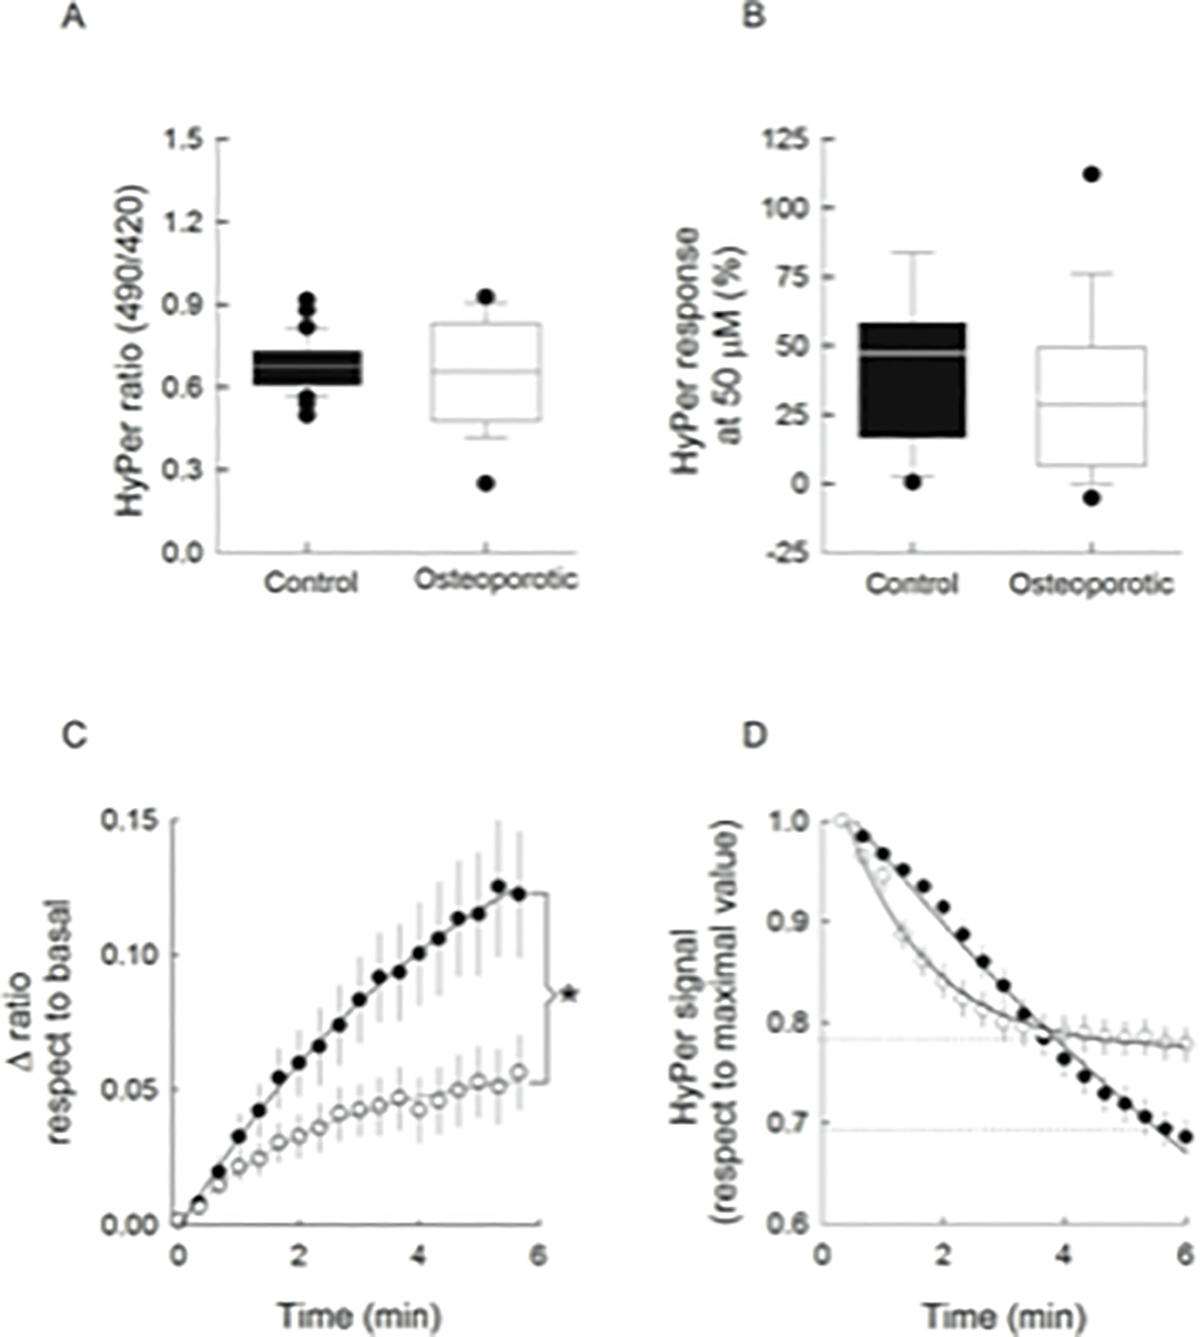
Figure 3.

Analysis of Data from MSCs expressing HyPer- exposed to H2O2 challenges. Data from base lines values (A), and of percentage of the HyPer response at 50 μM H2O2 pulse respect to the maximal value at 500 μM H2O2 pulse (B), for control (black boxes) and osteoporotic MSCs (white boxes). A line across the boxes indicates the median and error bars point out the 5th and 95th percentiles. Time course of the HyPer signal at 50 μM H2O2 respect to corresponding base line value, in c-MSCs (filled circles) and o-MSCs (open circles) (C). *p<0.05, according to Mann-Whitney rank sum test HyPer signal decay after 500 μM H2O2 pulse from control (filled circles) and from osteoporotic MSCs (open circles) (D). Dotted lines indicate the equilibrium attained by both cell types. Data were fitted to exponential functions and correspond to the mean ± SE. All data were obtained from 33 individual control cells from 4 different donors and from 39 individual osteoporotic cells from 4 different donors.
