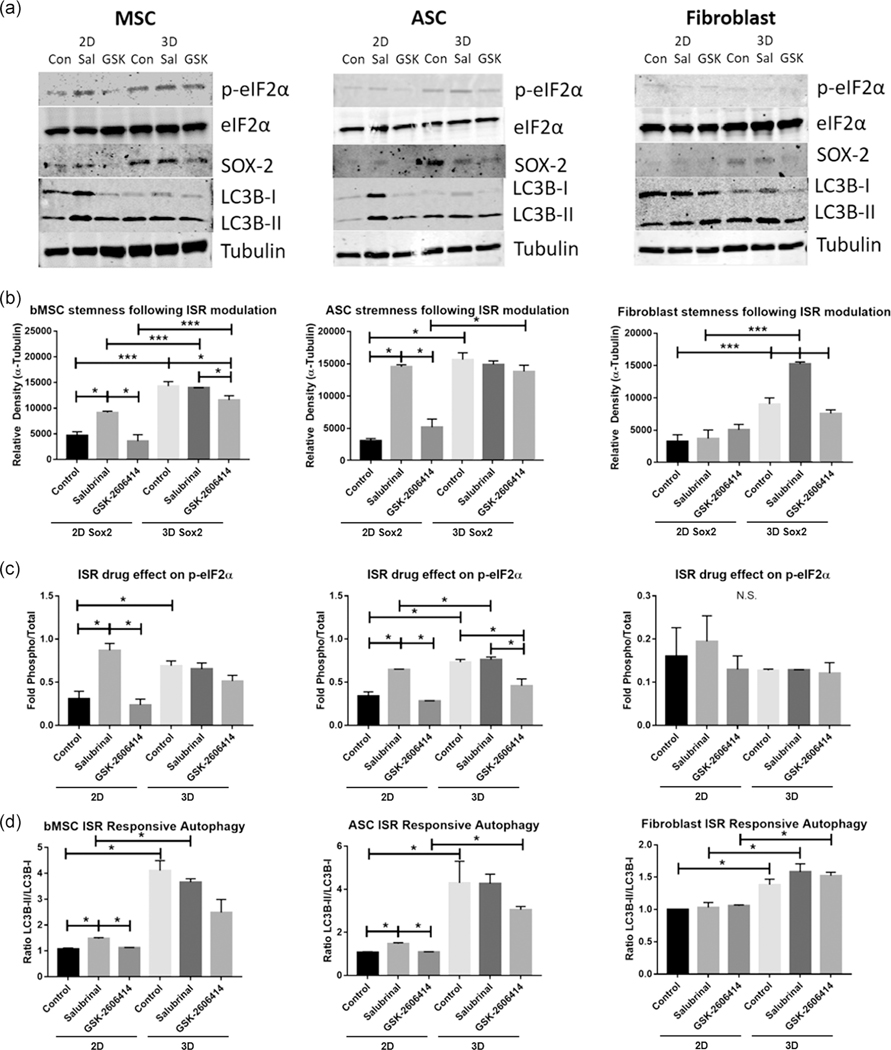
FIGURE 5.
Western blot evaluation of stem cell functionality following modulation of integrated stress response (ISR) with small molecules salubrinal and GSK-2606414. (a) Western blot images for bMSCs, ASCs, and FBs. (b) Relative density for protein SOX-2 (i.e., the density of SOX-2 band normalized to the density of α-tubulin band). (c) Fold of phosphorylated eIF2α (p-eIF2α) relative to total eIF2α (i.e., the density of p-eIF2α band divided by the density of eIF2α band), indicating level of ISR response as determined by phosphorylation of eIF2α. (d) Measure of autophasome biogenesis via ratio of LC3B-II/LC3B-I (i.e., the density of LC3B-II band divided by the density of LC3B-I band). Data represent the mean of at least three independent determinations; errors represent the standard error in the mean. ASC, adipose tissue; bMSC, MSCs derived from bone marrow; eIF2, eukaryotic initiation factor 2; FB, fibroblast. *p < .05, ***p < .01

