
Figure 1.
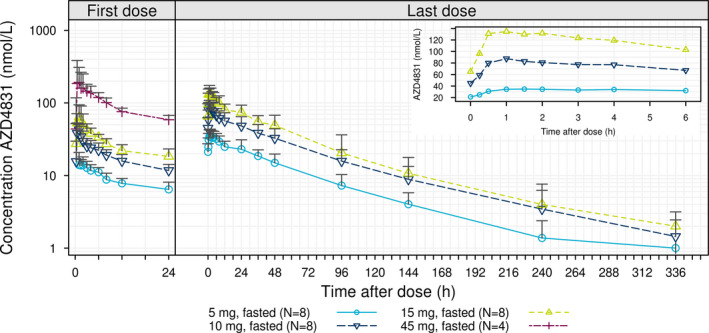
Geometric mean + SD* for plasma concentration‐time profiles by treatment following multiple ascending doses of AZD5718 (after first and last dose). Insert; first 6 hours after the last dose. *Geometric mean + SD is to be interpreted as exp(mean of log transformed values + SD of log transformed values).