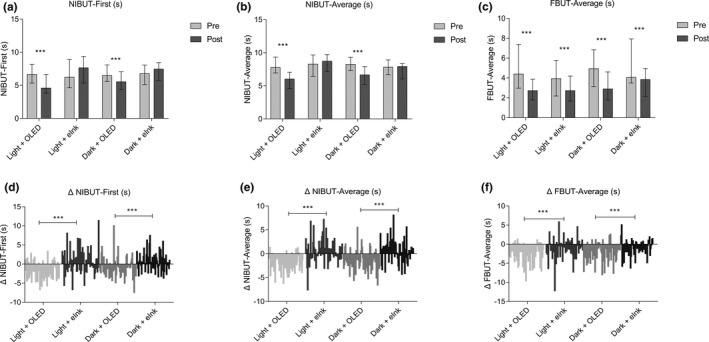
Figure 1.

Effects of two different screens on the stability of tear film. (a–c) show data presented as median and interquartile ranges. The difference values (D‐value) equal to the values of post‐reading minus the baseline values (Δ = post–pre) were compared to evaluate the different effects of the two smartphone screens on the ocular surface. (d–f) show the difference distribution of related detection indexes before and after reading. (post–pre = Δ). ***P ≤ 0.001. eInk, electronic ink; FBUT, fluorescein break‐up time; NIBUT, noninvasive break‐up time; OLED, organic light‐emitting diode.
