FIGURE 1.

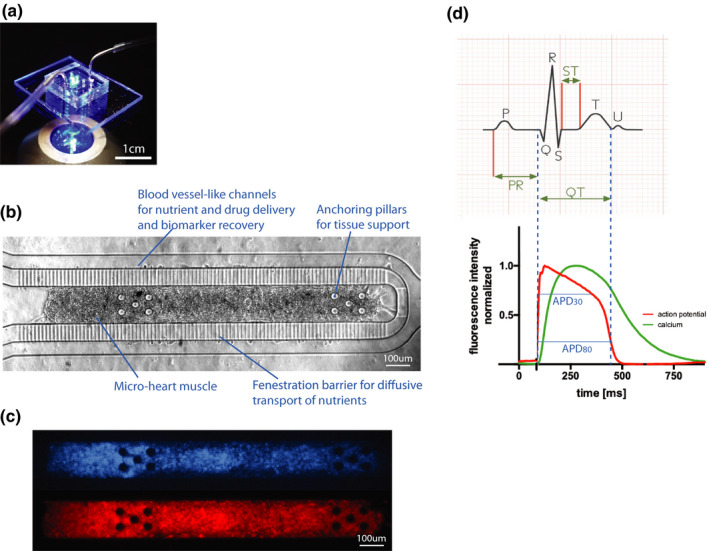
The cardiac microphysiological system. (a) Photograph of a cardiac MPS under fluorescent lighting with fluidic tubing to deliver media and drugs. (b) Brightfield image of a cardiac MPS containing ~ 2,500 human induced pluripotent stem cell‐derived cardiomyocytes. The cell chamber is separated from adjacent feeding channels via a fenestration barrier of 2 μm wide grooves allowing for nutrient diffusion while protecting the tissue in the cell chamber from media flow‐induced shear stress. The anchoring pillars on either side of the cell chamber help keep the heart muscle elongated and provide resistance for contraction. (c) Representative images of the same tissue under GFP fluorescence for calcium transient recordings (top) or FarRed voltage dye staining (bottom). (d) The top graph shows a typical ECG recording from which the clinical QT interval can be determined. We use APD80 as a proxy for QT duration, corresponding to the duration of the action potential at 80% of its repolarization (bottom). The APD (red) and Ca (green) waveforms are timestamped identifying temporal kinetics. APD80, 80% repolarization time; Ca, calcium; ECG, electrocardiogram; GFP, green fluorescent protein; MPS, microphysiological system
