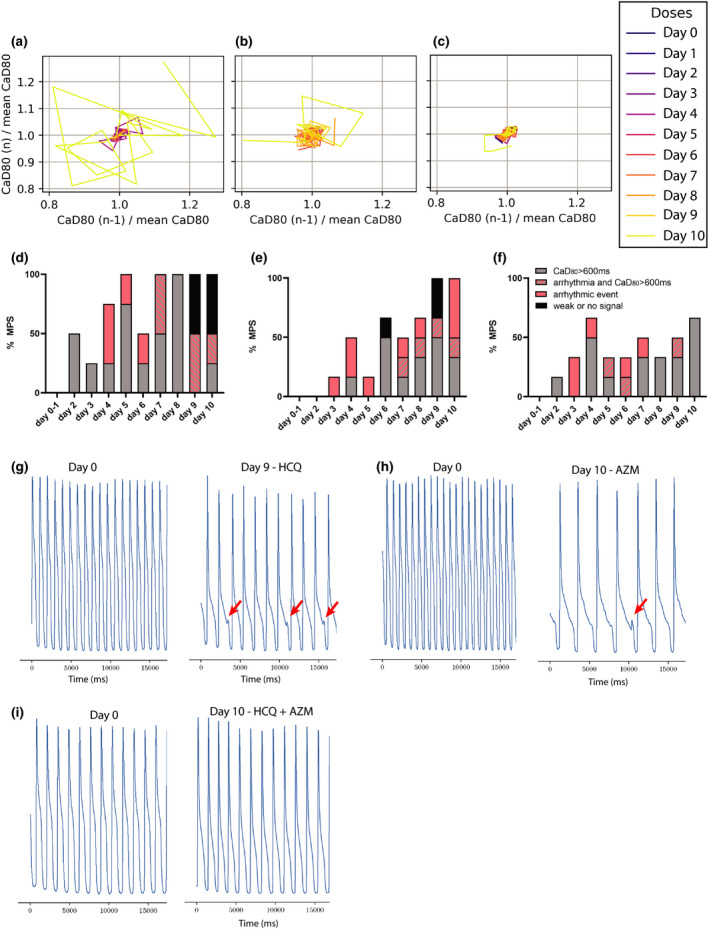
FIGURE 3.

Instability and arrhythmic study of chronic exposure to hydroxychloroquine (HCQ), azithromycin (AZM) and their polytherapy. Poincaré plots 36 , 49 were used to visualize rhythm instabilities in different tissues. Where small clusters of daily traces represent minimal arrhythmic risk, and large complex polygons are indicative of rhythm instability and high arrhythmic risk. (a) Representative Poincaré graph of a tissue exposed to HCQ only. Disorganized polygons can be observed at days 5 and 10 indicative of drug‐induced arrhythmia. (b) Poincaré graph of AZM‐treated heart muscle where instabilities were observed starting on day 6. (c) Representative graph of polytherapy instabilities, which show fewer and smaller polygons when compared to monotherapy, indicative of reduced arrhythmic risk. (d–f) Histograms showing weak or no signal (black), CaD80 above 600 ms with (striated) or without (grey) early afterdepolarization (EAD) and arrhythmic event (pink) as percentage of total heart muscles (i.e., MPS). The analysis was performed for HCQ alone (d), AZM alone (e), and for polytherapy (f). Representative calcium transient trace at baseline and after exposure to 9 days of HCQ (g) or 10 days of AZM (h) where EAD instances can be observed (red arrows). (i) Representative calcium transient trace at 10 day exposure of polytherapy showing no EADs
