FIGURE 3.

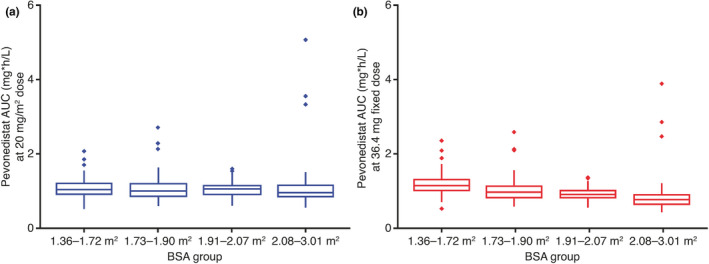
Comparison of simulated distribution of pevonedistat plasma exposures between (a) BSA‐adjusted dosing and (b) fixed dosing. AUC, area under the concentration‐time curve; BSA, body surface area

Comparison of simulated distribution of pevonedistat plasma exposures between (a) BSA‐adjusted dosing and (b) fixed dosing. AUC, area under the concentration‐time curve; BSA, body surface area