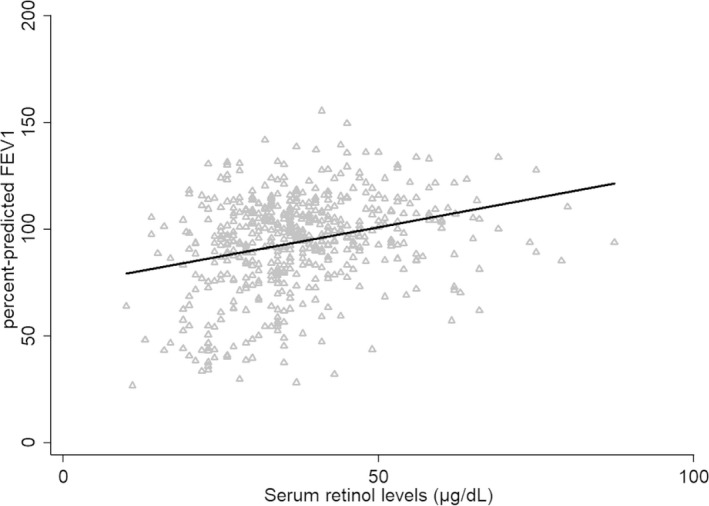
FIGURE 1.

Graphic representation of the correlation between the SRL and ppFEV1 as predicted by the GEE model. The triangles represent measured values. SRL, serum retinol levels; ppFEV1, percent‐predicted forced expiratory volume in 1 second; GEE, generalized estimating equations.
