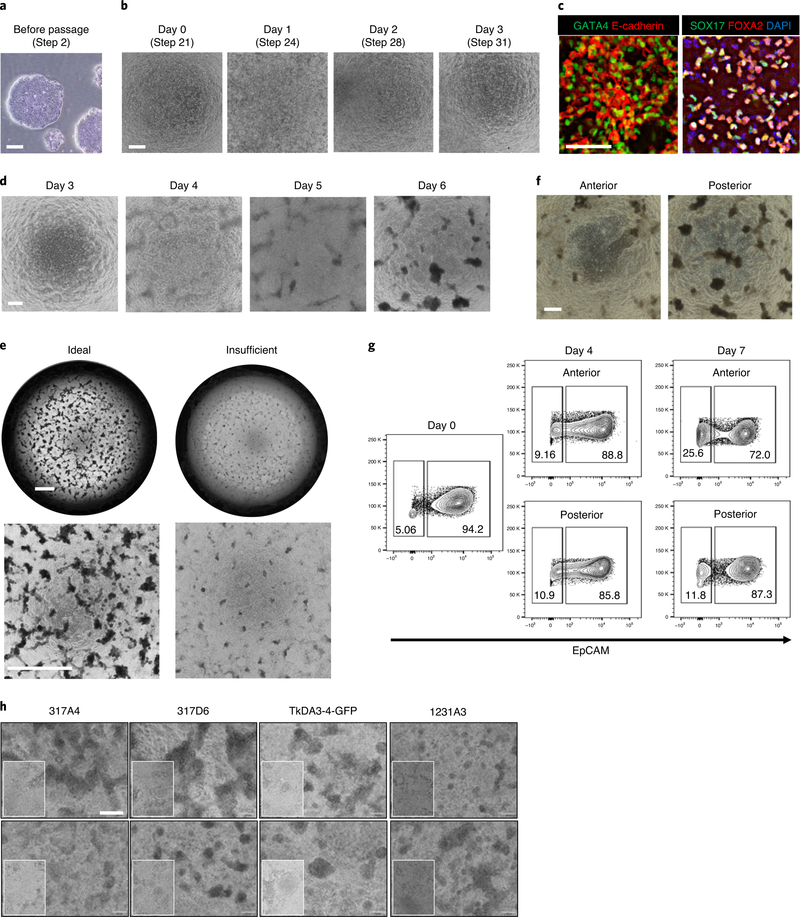
Fig. 2 |. Representative images of PSC differentiation into definitive endoderm and anterior/posterior gut cells.
a, Typical morphology of PSC colonies cultured on Matrigel and mTeSR1 medium before passage at day −2. Images are representative of six independent PSC lines with similar results. b, Bright-field images of PSCs from day 0 to day 3 at the definitive endoderm stage. c, Optimal differentiation of PSCs into definitive endoderm displays ~90% of GATA4, E-cadherin positive expression and ~80% SOX17 and FOXA2 double-positive expression by day 3. d, Bright-field image of PSCs from day 3 to day 6. e, Low-magnification images of posterior foregut cells at day 7. The left images are representative of an ideal differentiation; the right images are an example of insufficient differentiation. f, Bright-field images of anterior and posterior gut cells at day 7. g, Flow cytometry analysis of anterior or posterior gut cells. 70–90% of cells were EpCAM positive epithelial cells. h, Confirmation of reproducibility by using various PSC lines. Scale bars, 200 μm (a,b,d,f and h), 100 μm (c) and 500 μm (e).

